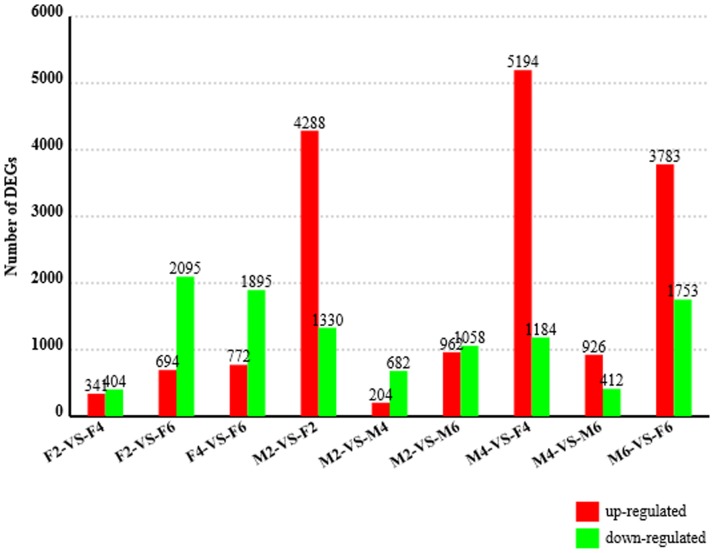
Figure 5. Differentially expressed genes between each sample pair.
Note: The number of differentially expressed genes found in each sample pair, expressed as the number of up-regulated and down-regulated genes. The first sample in each comparison is considered the control sample. For example, in the F2-VS-F4 comparison, 341 genes are up-regulated in F4 compared to F2.

