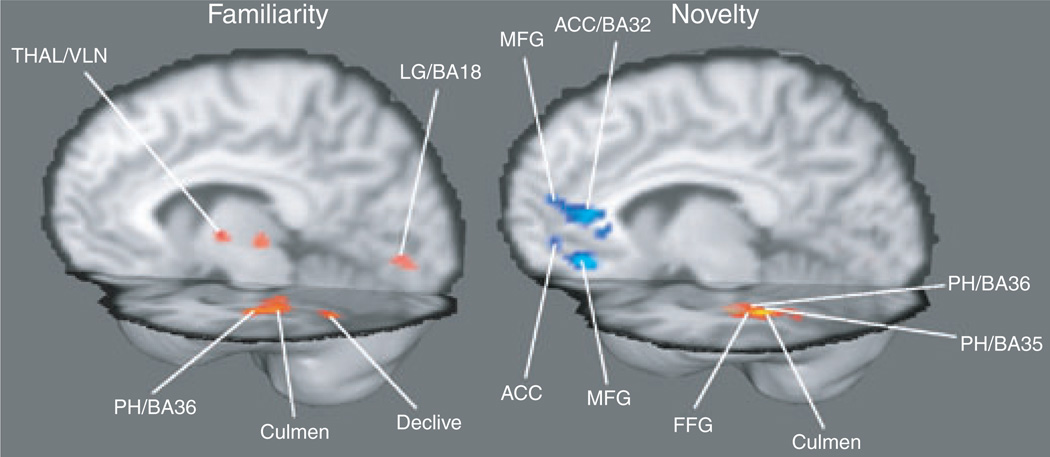
Fig. 3.
Group differences in each of the two conditions. Maps reflect spatial mixture modeling thresholded conservatively at p < 0.0001 and z > 2.3. Blue indicates where remitted bipolar patients showed greater activation than controls, and red indicates where controls were hyperactive relative to remitted bipolar patients. ACC = anterior cingulate cortex; FFG = fusiform gyrus; LG = lingual gyrus; MFG = medial frontal gyrus; PH = parahippocampus; THAL = thalamus; VLN = ventrolateral nucleus.

