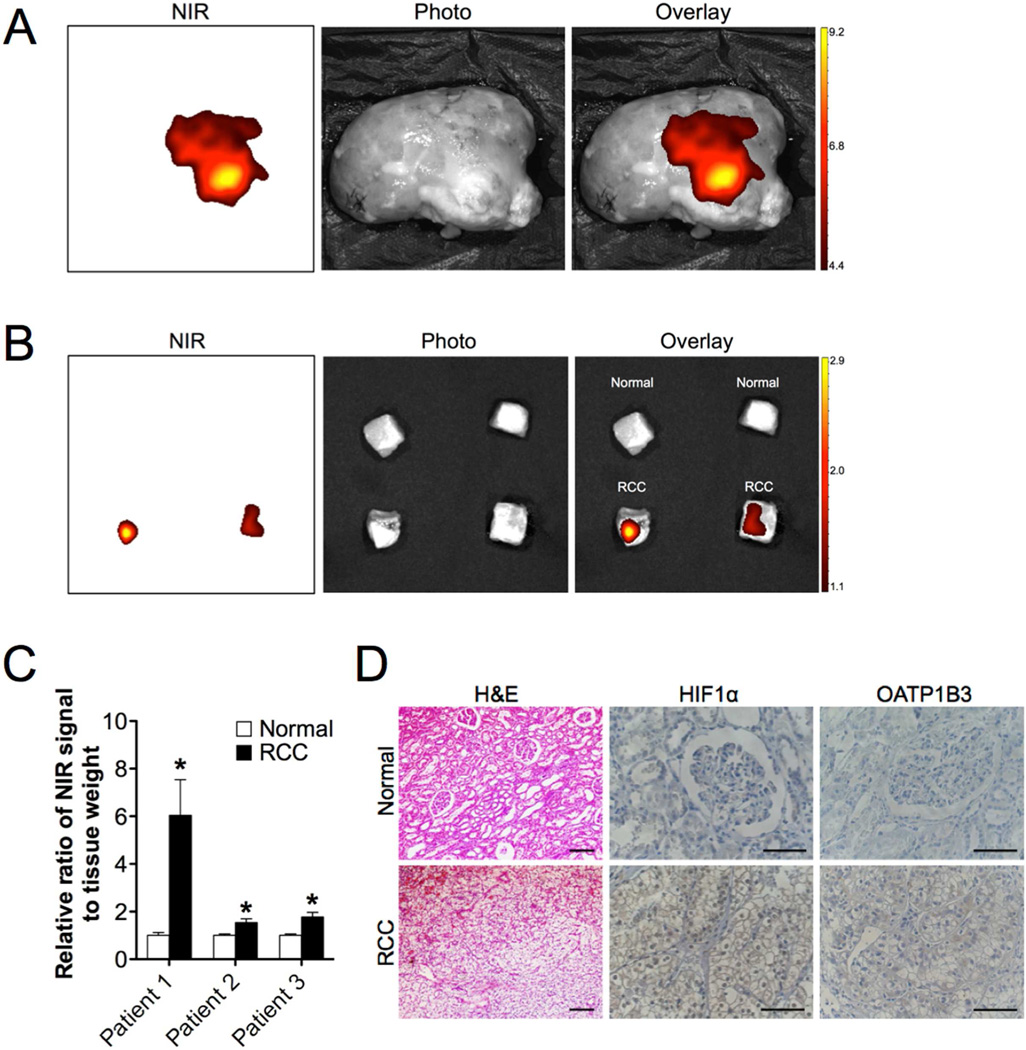
Fig. 6.
NIRF imaging of clinical RCC samples. (A, B) Representative NIRF images of excised kidney by complete nephrectomy (A) as well as small cuts of normal (B, top) and RCC tissues (B, bottom) from an individual patient. Scale bars represent x109 and x108 for (A) and (B), respectively, in the unit of radiant efficiency. (C) Quantitation of MHI-148 dye uptake in normal and tumor tissues from three RCC patients, presented as the ratio of dye intensity to tissue weight from five cuts of tissues of each patient (mean ± SEM). (D) H&E stain and IHC analysis of HIF1α and OATP1B3 expression in normal and RCC samples. Representative images are shown. Original magnification, x200 (H&E) and x400 (IHC); scale bars represent 20 µm. *p<0.05.

