
Figure 3.
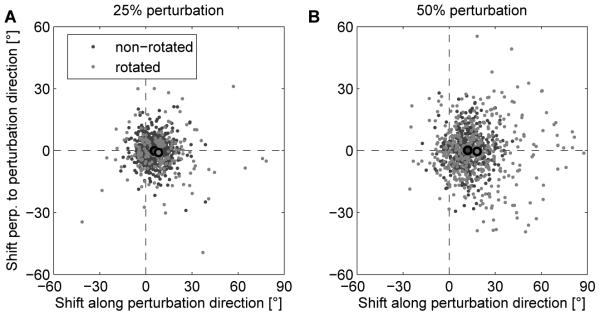
PD shifts in simulated Perturbation sessions are in good agreement with experimental results (compare to Figure 3A,B in [1]). Shift in the PDs measured after simulated perturbation sessions relative to initial PDs for all units in 20 simulated experiments where 25% (A) or 50% (B) of the units were rotated. Dots represent individual data points and black circled dots represent the means of rotated (light gray) and non-rotated (dark gray) units.