Figure 6.
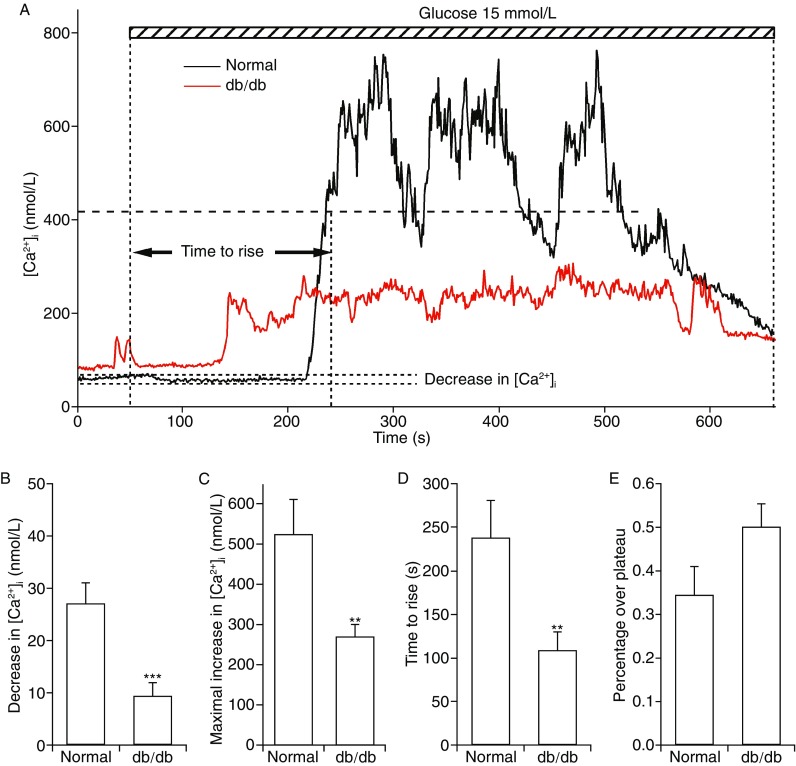
Altered glucose-triggered calcium oscillations in db/db beta-cells. (A) Representative examples of calcium oscillations triggered by glucose (15 mmol/L) in one beta-cell from normal mice (dark) and in one beta-cell from db/db mice (red). The initial decrease in [Ca2+]i was quantified as the difference between the resting [Ca2+]i and the minimal [Ca2+]i reached within 120 s after glucose perfusion. The maximal increase in [Ca2+]i was calculated as the difference between the resting [Ca2+]i and the maximal [Ca2+]i reached within the period of glucose perfusion. The time to rise was defined as the time delay between the perfusion of glucose and the time when [Ca2+]i reached 50% of the maximal increase in [Ca2+]i. Finally, the percentage over plateau of each trace was defined as the time during which the [Ca2+]i was greater than 50% of the maximal increase divided by the total time of glucose stimulation. (B, C, D, E) Compared to normal cells (n = 23), pancreatic beta-cells from db/db mice (n = 21) exhibited a reduction in the average initial decrease in [Ca2+]i (B), a reduction in the average maximal increase in [Ca2+]i (C), and an accelerated response to glucose (D). Although db/db cells spent a slightly greater percentage of time at [Ca2+]i greater than 50% of the maximal increase in [Ca2+]i during glucose stimulation, the average difference compared to normal cells was not significant (E)

