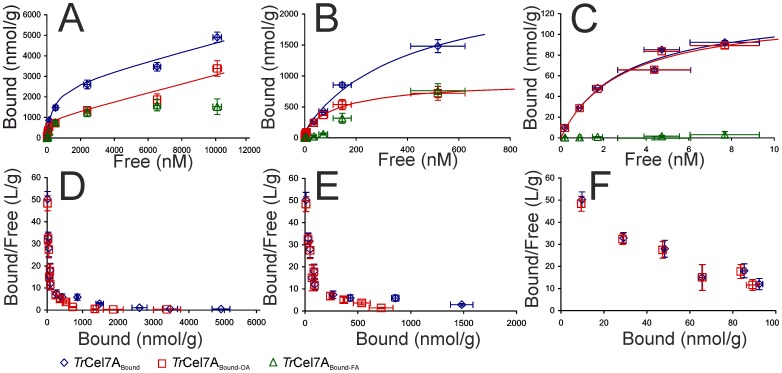
Figure 1. Variation of free enzyme concentration over 4 orders of magnitude reveals multi-mode binding of TrCel7A to BC.
[Free] – [Bound] plots (A – C) and Scatchard plots (D – F) of binding of TrCel7A to BC (1 g/L). Full binding isotherm is dissected into three regions with different dominating binding modes. The low affinity binding mode dominates at free TrCel7A concentrations ([TrCel7A]Free) above 1.0 µM (A and D). The medium affinity binding mode dominates in the 0.1 µM – 1.0 µM range of [TrCel7A]Free (B and E). The high affinity binding mode dominates at [TrCel7A]Free up to 10 nM (C and F). Total bound TrCel7A (TrCel7ABound), TrCel7A bound through the active site (TrCel7ABound-OA), and bound TrCel7A with free active site (TrCel7ABound-FA). Solid lines represent best fits of Langmuiŕs one (C), two (B), and three (A) independent binding site model. Error bars are at least from three independent measurements.

