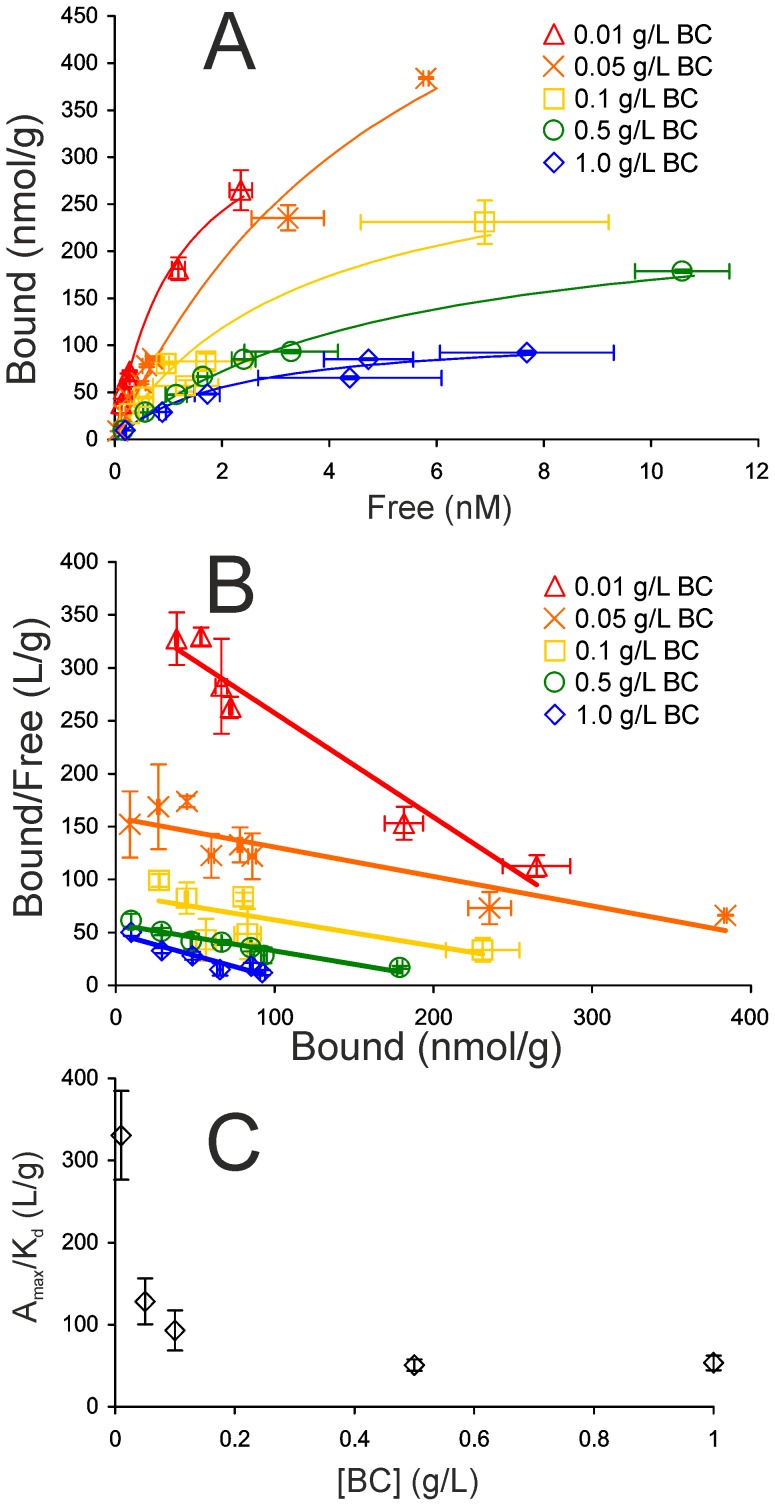
Figure 4. Binding isotherm of TrCel7A depends on BC concentration.
Binding isotherms (A), and corresponding Scatchard plots (B) of binding of TrCel7A (in the level of total bound TrCel7A) to BC at different concentrations. Solid lines represent best fits of Langmuiŕs one binding site model. Error bars are at least from three independent measurements. (C) A max/K d values at different BC concentrations.

