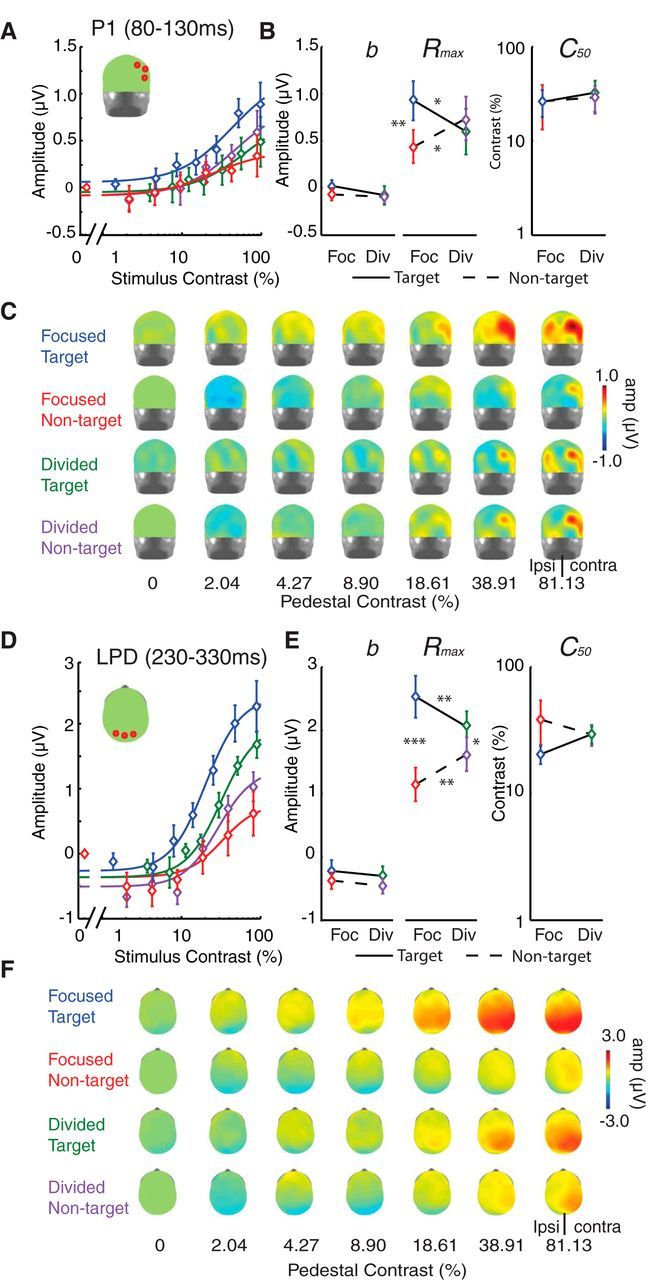
Figure 8.

Multiplicative response gain increases with focused attention in ERP CRFs. A, C, D, F, The mean amplitudes of P1 (A) and LPD (D) components are plotted as a function of stimulus contrast (see corresponding topographical maps in C and F, respectively). The CRFs for focused-attention targets (blue), focused-attention nontargets (red), divided-attention targets (green), and divided-attention nontargets (purple) were fit with a Naka-Rushton equation (Eq. 2). B, E, A bootstrapping analysis showed that the attentional enhancement on the P1 and LPD components was selectively driven by changes in the response amplitude parameter (Rmax; B, E, middle), and the baseline (b, left) and the semisaturation contrast parameters (C50, right) did not significantly change. Error bars in A and D indicate ±SEM across subjects. Error bars in B and E represent 68% confidence intervals from the bootstrapping analysis. *, **, and *** Indicate significance based on post hoc pairwise comparisons corrected by the Holm-Bonferroni method at p < 0.05, p < 0.01, p < 0.001, respectively.
