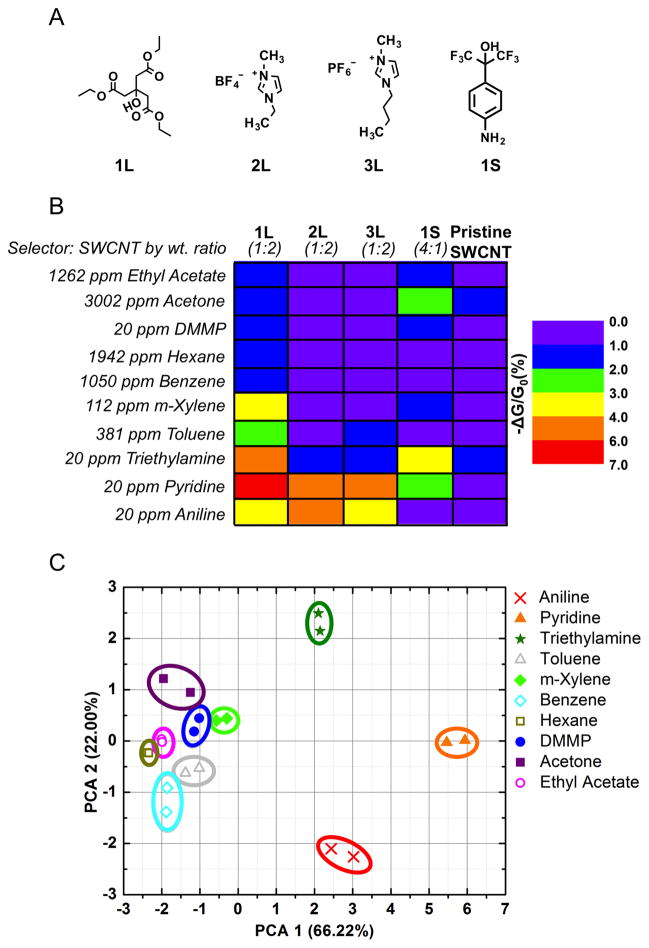
Fig 4.
Fully-Drawn Sensor Array. A) Schematic diagram of the selector’s chemical structure used in the sensor array. L represents selectors that are liquids (Bp > 200°C) and S represents selectors that are solids at room temperature prior to mixing with SWCNTs. The selectors were mixed with pristine SWCNTs mechanically and compressed into a pellet to make PENCILs. B) Average normalized conductive response (first exposure exempt) to simultaneous exposure to various gas analytes at ppm concentrations 5 consecutive times for 30 s with a 60 s recovery time. The PENCILs were deposited by DRAFT on weighing paper and the carbon-based electrodes (with 1 mm gap size) were deposited by abrasion using graphite pencil on the etched surface of weighing paper. C) Principal Component Analysis (PCA) plot discriminates between various gas analytes from the average conductive responses (first exposure exempt) of the sensor array.

