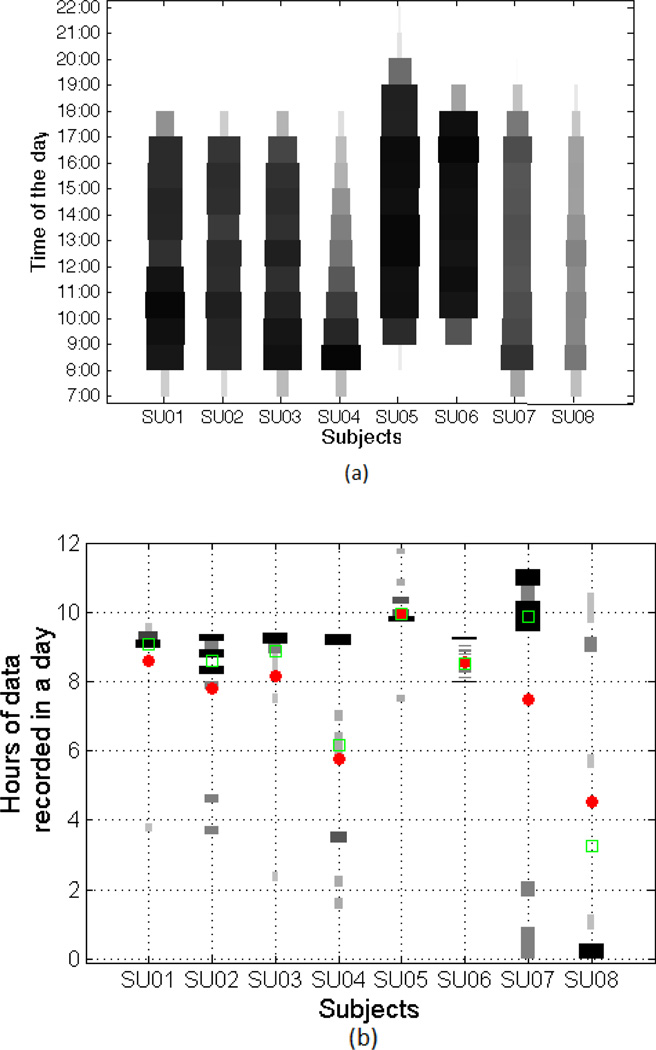
Figure 4.
Amount of data recorded for different subjects through out the 10 day pilot study. (a) shows the amount of recorded data at different parts of a day. Wider and darker horizontal bars represent more recording during that part of the day. (b) shows distribution of the hours of data recorded on each day for a given subject. For example, subject 02 recorded close to 9 hours of data on most days but has a couple of days where she records between 3.5–4.5 hours of data. The red dot represent the mean and the green square represents the median number of recorded hours per day for each subject.

