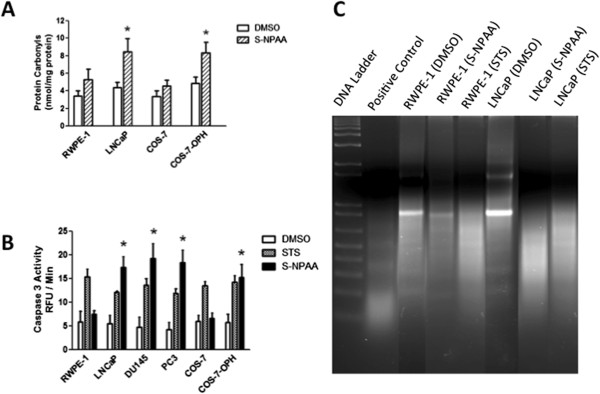
Figure 6.

LNCaP and COS-7-OPH show increased oxidative stress and apoptosis after treatment with S-NPAA. A) RWPE-1, LNCaP, COS-7, and COS-7-OPH cell cultures were incubated with 25 μM S-NPAA for 6 hours. Protein carbonyl levels were measured in cellular lysates as described in the Methods Section. B) RWPE-1, LNCaP, DU145, PC3, COS-7, and COS-7-OPH cell cultures were incubated with 25 μM NPAA or 5 μM staurosporine (STS) as a positive control for 6 hours and caspase-3 activities in cellular lysates were measured as described in the Methods Section; *indicates that the S-NPAA treatment was significantly different from control (vehicle) at p < 0.05. C) RWPE-1 and LNCaP lysates were also examined for DNA fragmentation under the same conditions.
