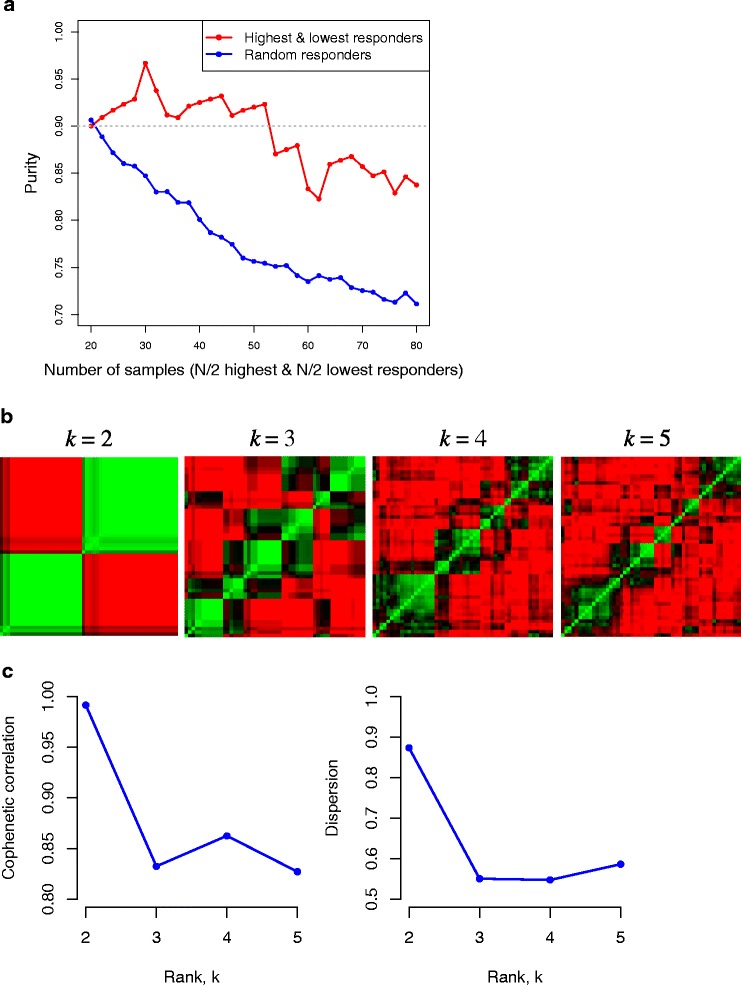
Figure 1.

Summary of the NMF clustering results. (a) Purity curves measuring the performance of NMF in clustering. The red line was calculated from the N/2 highest and N/2 lowest samples (N = 20, …, 80) and the blue line was obtained from the N randomly selected samples from the entire set of samples. Purity cutoff, 0.9, is denoted with a grey dotted line. (b) Consensus matrices for the 26 highest and 26 lowest responder samples, averaging 500 connectivity matrices computed at k = 2, 3, 4, 5. Comparison of the visualized consensus matrices across different ranks is a graphical way of deciding the best rank since clear block patterns along the diagonal of the consensus matrices indicate robustness of clustering in the corresponding ranks. (c) Cophenetic correlation and dispersion measures assessing the stability of clustering associated with each rank k.
