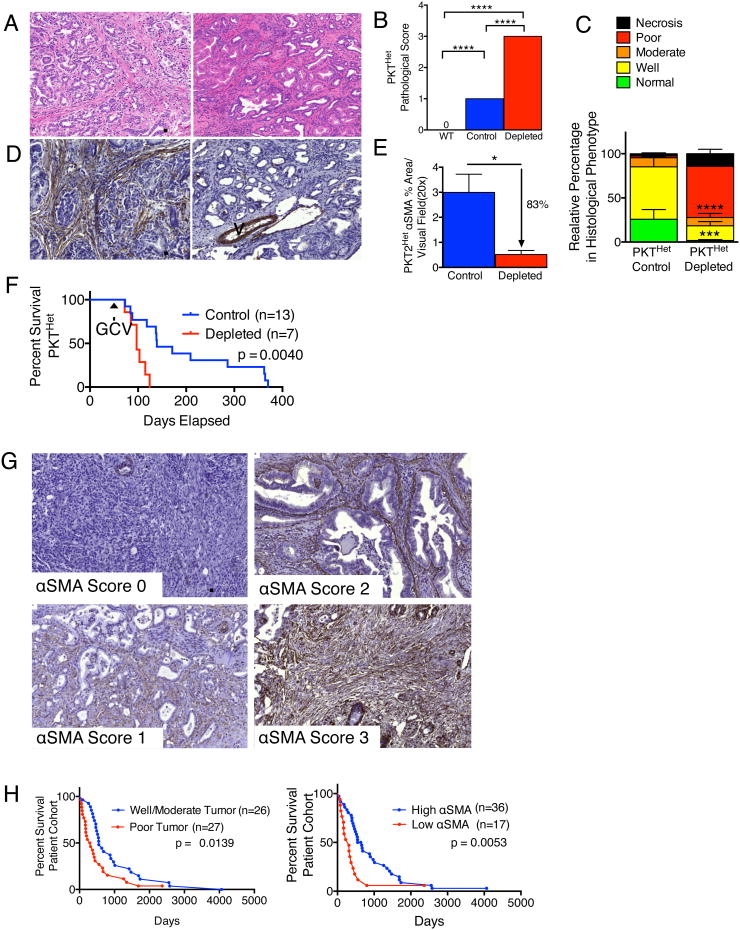
Figure 2. Decreased αSMA correlates with poor prognosis and overall survival in slow-progressing mice with PDAC and patients with pancreatic cancer.
(A, B) Representative micrographs of H&E stained PKTHet tumors at 106 (Control, left) and 103 (Depleted, right) days old (A, scale bar: 100 μm) and pathological scores (B). WT, n=5; Control, n=6; Depleted, n=4. Significance determine by One-way ANOVA with Turkey post-hoc analysis. (C) Relative percentage in histological phenotypes (n=6 and 4, respectively, for control and depleted). (D, E) Representative micrographs of αSMA stained pancreatic samples as in (A) (D, scale bar: 100 μm) and corresponding quantification (E). n=6 and 4, respectively, for control and depleted. V: vessel. (F) Survival analysis in PKTHet mice. GCV: ganciclovir treatment was initiated. (G) Representative micrographs of αSMA stained pancreatic samples resected from patients in each score category :0, 1, 2 and 3 (scale bar: 200 μm). (H) Survival analysis based on histopathological score (left) and αSMA score (right). Low αSMA: scores 0 and 1; high αSMA: scores 2 and 3. Significance determine by Mantel-Cox test. Data is represented as mean +/- SEM. Unless otherwise noted, significance was determine by t-test, * p<0.05, ** p<0.01, ** p< 0.001, ****p < 0.0001. ns: not significant. See also Figure S2 and Table S1.

