
Figure 3. PDAC extracellular matrix is significantly remodeled in myofibroblast-depleted tumors.
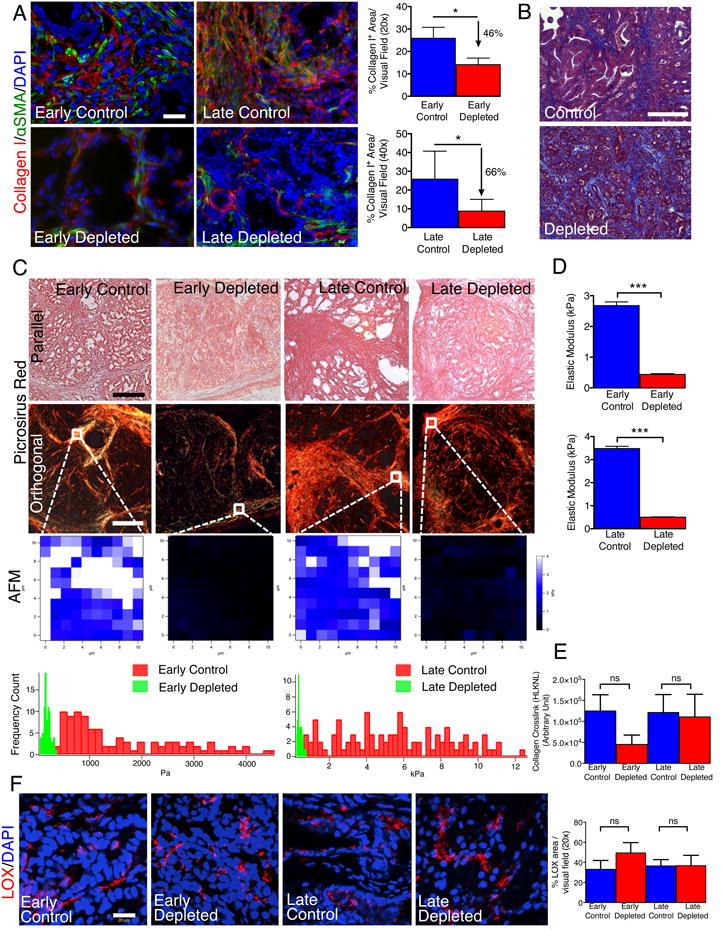
(A) Representative micrographs (scale bar: 50 μm) of Collagen I and αSMA and corresponding quantification (n=4). (B) Representative micrographs (scale bar: 200 μm) of Masson Trichrome staining in late control and late deleted mice. (C) Representative images of Picrosirius Red staining of PKT pancreatic tissues samples viewed under parallel (top row) and polarized light (second row) (scale bar: 75 μm), and representative images of stiffness distribution by atomic force microscopy measurement (AFM, third row) and quantification (bottom row, n=3). (D) Quantification of the elastic modulus of tumors matrix (n=3). (E) Collagen crosslinking quantification (n=4). (F) Representative micrographs for LOX (scale bar: 20 μm) and quantification. Data is represented as mean +/- SEM. Significance was determined by t-test, * p<0.05, ** p<0.01, ** p< 0.001, ****p < 0.0001. ns: not significant. See also Figure S3 and Table S2.