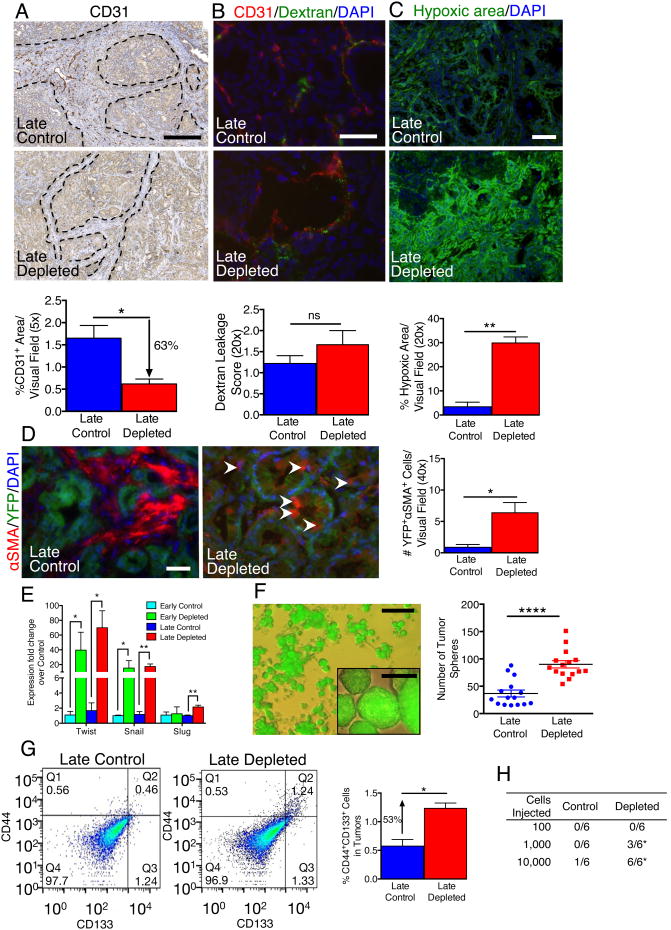
Figure 4. Myofibroblast-depleted tumors display increased invasion associated with intra-tumoral hypoxia.
(A) Representative micrographs (scale bar: 100 μm) of CD31 staining and corresponding quantification (n=4). Dashed lines delineate the stromal compartment where CD31+ vessels are primarily found. (B) Representative micrographs (scale bar: 100 μm) and corresponding quantification (n=4) of CD31 cells and intra-tumoral FITC-Dextran leakage. (C) Representative micrographs (scale bar: 100 μm) of hypoxia indicator, Hypoxyprobe™, and corresponding quantification (n=4). (D) Representative micrographs (scale bar: 50 μm) of αSMA+ cells in tumors with YFP+ linage tagged cancer cells and corresponding quantification (n=4). White arrowheads point to αSMA+YFP+ cells. (E) Relative Twist, Snail and Slug expression in tumors. (F) Representative micrograph (scale bar: 100 μm) of YFP+ tumor spheres (insert shows higher magnification micrograph, scale bar: 25 μm) and corresponding quantification (n=15). (G) Representative scatter plot and quantification of percent CD44+CD133+ cancer cells (Control: n=2, Depleted: n=3). Q1: CD44+CD133-; Q2: CD44+CD133+; Q3: CD44-CD133+; Q4: CD44-CD133-. (H) Tumorigenic ability of YFP+ cells determined by limiting dilution assay. For each cell dose, 6 mice were injected with YFP+ cancer cells from control or myofibroblast depleted tumors and data is presented as the number of mice displaying tumors. Significance was assayed by Χ2 test. Data is represented as mean +/- SEM. Unless otherwise noted, significance was determine by t-test, * p<0.05, ** p<0.01, ** p< 0.001, ****p < 0.0001. ns: not significant. See also Figure S4 and Table S3.

