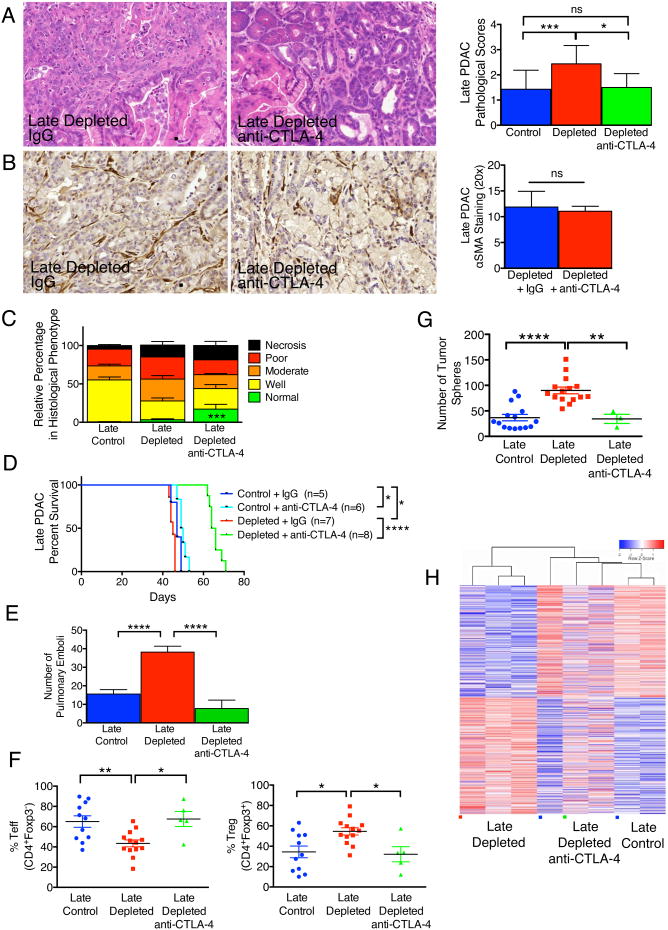
Figure 7. Anti-CTLA-4 attenuates PDAC and improves survival in mice with myofibroblast-depleted tumors.
(A) Representative micrographs of H&E stained tumors (scale bar: 100 μm) and pathological scores of tumors in indicated experimental groups. Control, n=14; Depleted, n=16; Depleted + anti-CTLA-4, n=6. Significance was determined by One-way ANOVA with Turkey post-hoc analysis. (B) Representative micrographs of αSMA stained pancreatic samples (scale bar: 100 μm) and corresponding quantification. Depleted, n=5; Depleted + anti-CTLA-4, n=7. (C) Relative percent of tissue encompassed by each histology hallmark. Control, n=15; Depleted, n=16; Depleted + anti-CTLA-4, n=6. Significance was determined by One-way ANOVA with Turkey post-hoc analysis. (D) Survival analysis of the indicated experimental groups. (E) Number of pulmonary emboli. Control, n=14; Depleted, n=28; Depleted + anti-CTLA-4, n=8. (F) Percent Teff (left) and Treg (right) cells in tumors of indicated experimental groups. (G) Number of spheres formed from tumors of indicated experimental groups. (H) Heat map of differentially expressed genes in the indicated groups. Data is represented as mean +/- SEM. Unless otherwise noted, significance was determine by t-test, * p<0.05, ** p<0.01, ** p< 0.001, ****p < 0.0001. ns: not significant. See also Figure S6.

