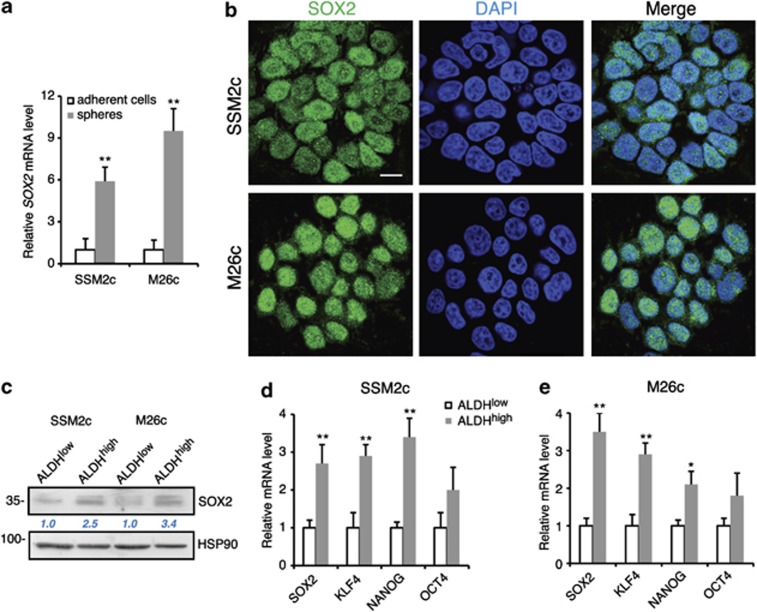
Figure 2.
SOX2 expression is enhanced in melanoma cells with stem cell features. (a) SOX2 mRNA expression analysis in adherent cells and spheres of SSM2c and M26c melanoma cells measured by qPCR. Ct values were normalized with two housekeeping genes, with the values in adherent cells equated to 1. (b) Confocal images of M26c and SSM2c melanoma spheres after immunolabeling with anti-SOX2 antibody. Nuclei were counterstained with DAPI. Scale bar=10 μm. (c) Western blotting analysis of FACS-sorted ALDHlow and ALDHhigh SSM2c and M26c cells showing the level of SOX2 protein. HSP90 was used as loading control. Quantification of the ratio SOX2/HSP90 is shown in blue. (d, e) qPCR analysis of SOX2, KLF4, NANOG and OCT4 expression in FACS-sorted ALDHlow and ALDHhigh SSM2c and M26c cells. Ct values were normalized with two housekeeping genes, with values in ALDHlow cells equated to 1. *P⩽0.05; **P⩽0.01.

