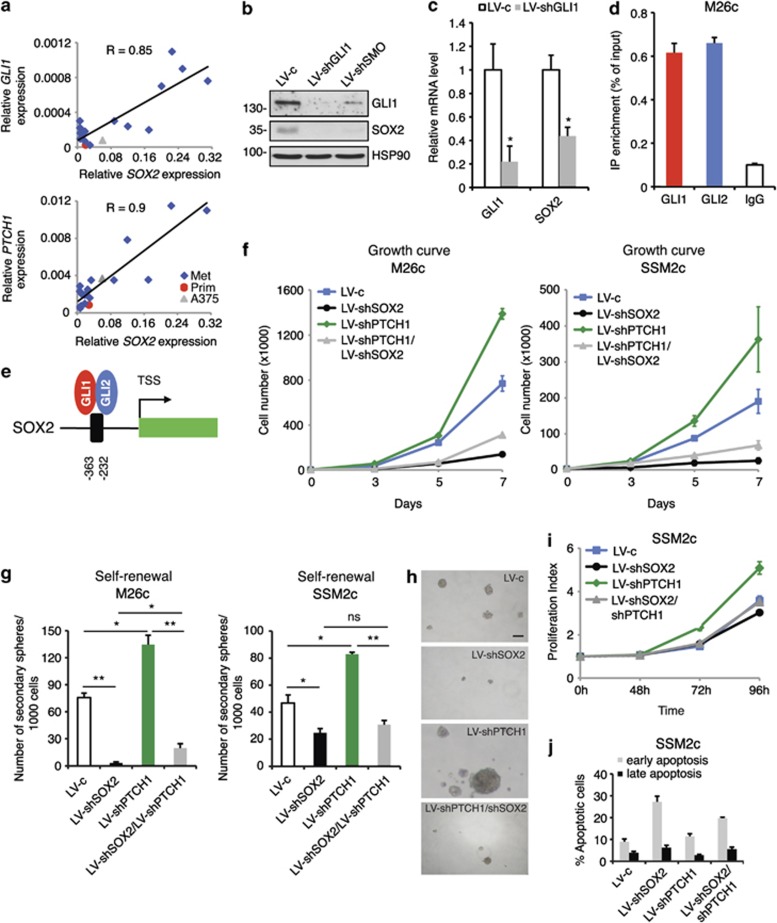
Figure 7.
SOX2 is regulated by HH signaling and is required for melanoma cell growth and MIC self-renewal induced by HH activation. (a) Linear correlation analysis of SOX2 with GLI1 and PTCH1 expression, as measured by qPCR, in the melanoma cell line A375 and in 19 patient-derived melanoma cultures, 1 of which is from a primary melanoma (Prim) and 18 are from metastases (Met). Each sample is represented by a dot. Axes in each graph represent expression ratio of gene/(GAPDH and β-ACTIN). The extent of the correlation is indicated by R coefficient. (b) Western blotting analysis of SSM2c cells transduced with LV-c, LV-shGLI1 and LV-shSMO shows the dramatic reduction of GLI1 and complete loss of SOX2 protein upon inhibition of HH signaling. HSP90 was used as loading control. (c) qPCR analysis of SSM2c cells transduced with LV-c and LV-shGLI1, showing the drastic reduction of GLI1 and SOX2 mRNA. qPCR values reflect Ct values after normalization with two housekeeping genes, with the values in control equated to 1. (d) qPCR analysis of ChIP experiments shows binding of GLI1 and GLI2 at SOX2 promoter (−363 bp to −232 bp) in M26c melanoma cells. (e) Location of the putative GLI-binding site on SOX2 promoter. Numbers indicate the position of the binding site relative to the TSS. (f) Growth assay in M26c and SSM2c cells transduced with LV-c, shSOX2-1, shPTCH1 or shPTCH1/shSOX2-1, showing that SOX2 silencing reduces the increase in melanoma cell proliferation induced by shPTCH1. (g) Self-renewal assay showing that SOX2 ablation prevents the increase in self-renewal induced by shPTCH1 in M26c and SSM2c melanoma spheres. (h) Representative images of panel (g). (i) Proliferation index measured by CellTrace Violet staining in SSM2c spheres stably transduced with LV-c, LV-shSOX2-1, LV-shPTCH1 or LV-shSOX2-1/LV-shPTCH1. (j) Quantification of the fraction of early (Annexin V+/7-AAD−) and late (Annexin V+/7-AAD+) apoptotic cells in SSM2c spheres stably transduced with LV-c, LV-shSOX2-1, LV-shPTCH1 or LV-shSOX2-1/LV-shPTCH1. Scale bar=100 μm (h). Data represent mean±s.e.m. values. At least three independent experiments were performed. *P⩽0.05; **P⩽0.01.

