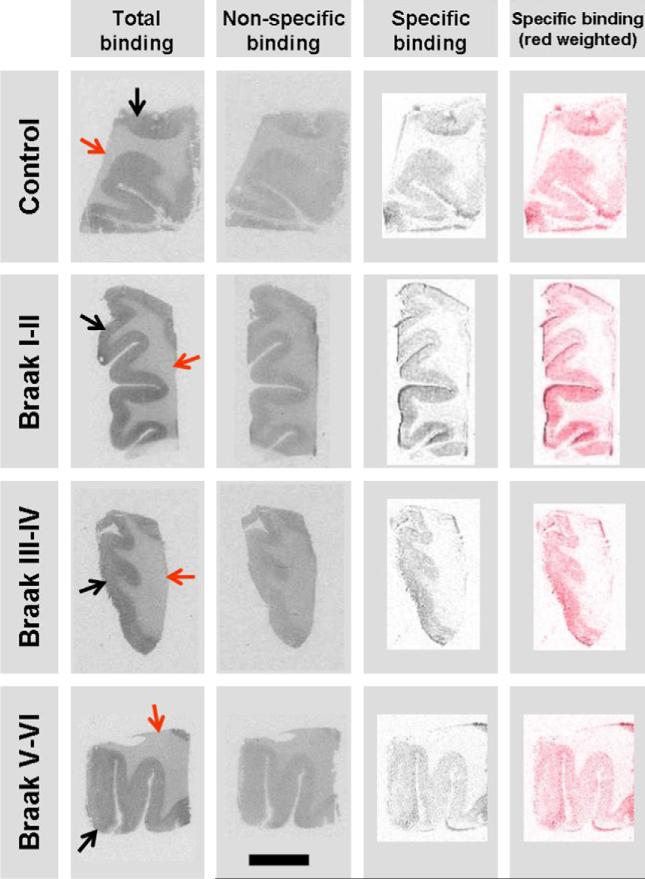
Fig. 1.
Characteristic CB1R autoradiographs of prefrontal cortex samples obtained with [125I]-SD-7015 as radioligand. The scale bar is 10 mm. In the fourth column the specific binding images (shown in the third column as grey-scale images) are red weighted. Red arrow = white matter, black arrow = cortex.

