
Figure 3. Proportion of Respondents Who Changed From Yes to No/Don’t Know Versus No/Don’t Know to Yes for the Seven Items in the Fallowfield Instrument.
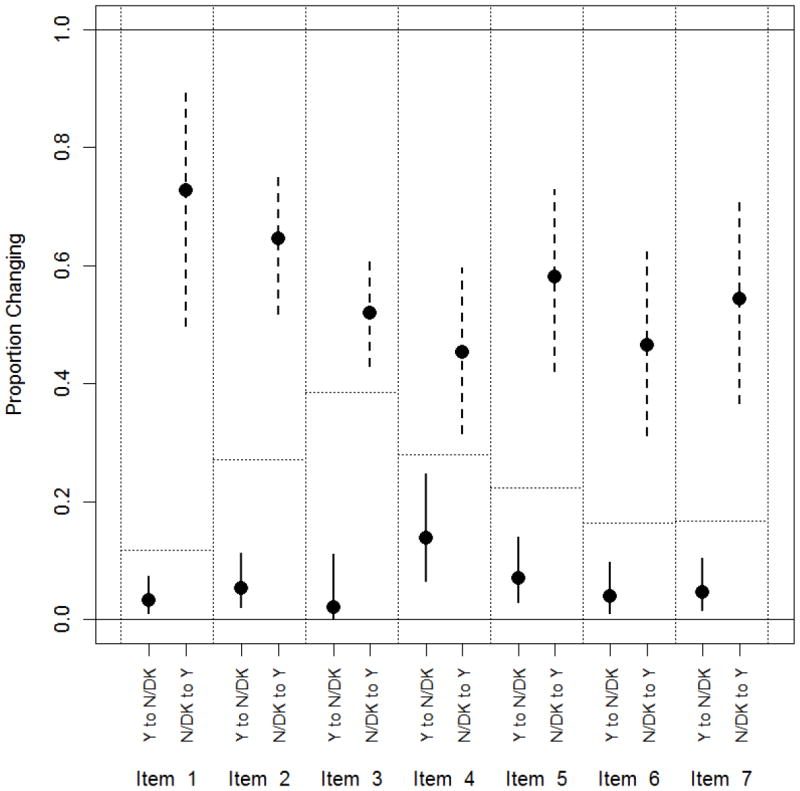
P<0.001 for items 1, 2, 5, 6 and 7; p=0.001 for item 3; p=0.008 for item 4. Horizontal dotted lines show the assumed null proportion of respondents who change their response from baseline.Due to some missing responses, the sample sizes vary per item for items 1 through 7, respectively, as follows: 178, 177, 177, 118, 143, 146, 144.