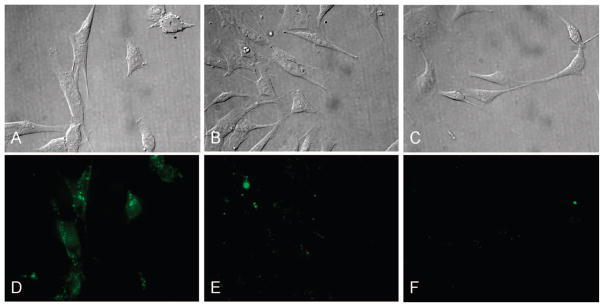
Figure 5.

Fluorescence imaging of 2D4 (CB2 expressing) and wild-type (WT, non-CB2 expressing) DBT cells: (A) phase contrast microscopy of 2D4 DBT cells dosed with 5 μM NIRmbc94; (B) phase contrast microscopy of WT DBT cells dosed with 5 μM NIRmbc94; (C) phase contrast microscopy of 2D4 DBT cells dosed with 5 μM NIRmbc94 and 100 nM SR144528; (D) fluorescence imaging of 2D4 DBT cells dosed with 5 μM NIRmbc94; (E) fluorescence imaging of WT DBT cells dosed with 5 μM NIRmbc94; (F) fluorescence imaging of 2D4 DBT cells dosed with 5 μM NIRmbc94 and 100 nM SR144528.
