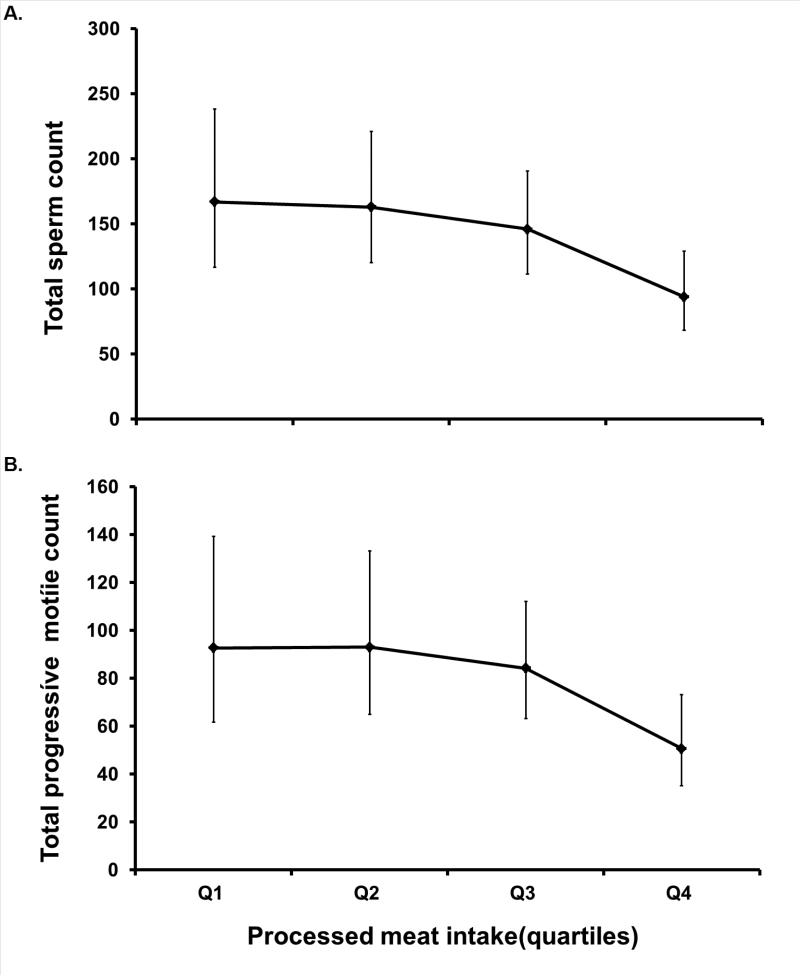
Figure. Processed meat intake quartiles in relation to (A) total sperm count (millions) and (B) total progressive motile count (million motile). Meat intake quartiles: Q1 = 0 - 0.42mL; Q2 = 0.44 – 0.85 mL; Q3 = 0.87 – 1.44mL; Q4 = 1.45 – 5.25mL.
Models are adjusted for age, abstinence time, race, smoking status, BMI, recruitment period, moderate-to-intense exercise, TV-watching, dietary patterns, and total calorie intake. Tests for trend were conducted across quartiles using a variable with the median processed meat intake in each quartile as a continuous variable in the linear regression models. for total sperm count, P =0.01; for total progressive motile count, P = 0.02.

