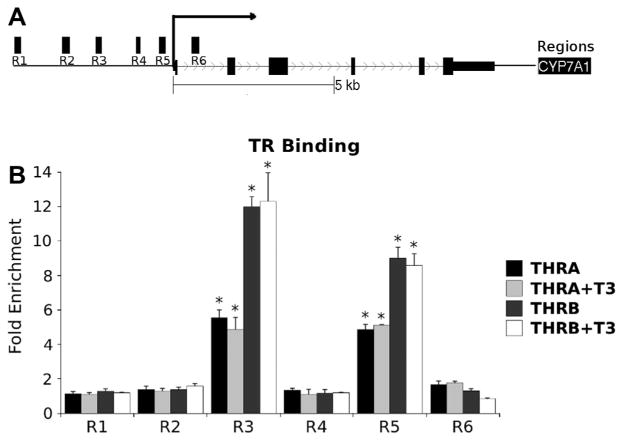
Fig. 6.

TRs bind to the Cyp7a1 proximal promoter. Upper panel is a schematic of the Cyp7a1 gene locus with positions of regions that were probed with ChIP primers. The lower panel depicts ChIP assays performed upon extracts of cells that express tagged TRα1 or TRβ1, as described in Section 2. Bars represent enrichment over IgG control, which was set to a value of 1. Note that TR binding only exceeds background in the R3 and R5 regions. Results of T-test indicated by * (P < 0.05).
