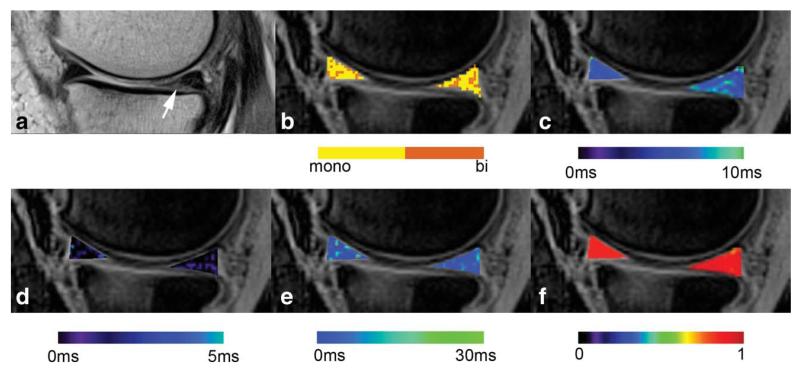
FIG. 2. An example of the map evaluation of a 68-year-old patient with meniscus degeneration (arrow), diagnosed in the posterior horn of the medial meniscus.
a: The morphologic image was acquired with a T2-weighted turbo-spin echo sequence; (b) the binary map of the pixels with biexponential (orange colored) and monoexponential (yellow colored) fit; (c) the conventional monoexponential T2* map; (d) the map of the short component T2* calculated biexponentially; (e) the map of the long component T2* calculated biexponentially; (f) the map of the coefficient of variation (R2) related to the precision of fit. Note that all maps are overlaid on the morphologic image and pseudo-color-coded with the corresponding color bar below each image.

