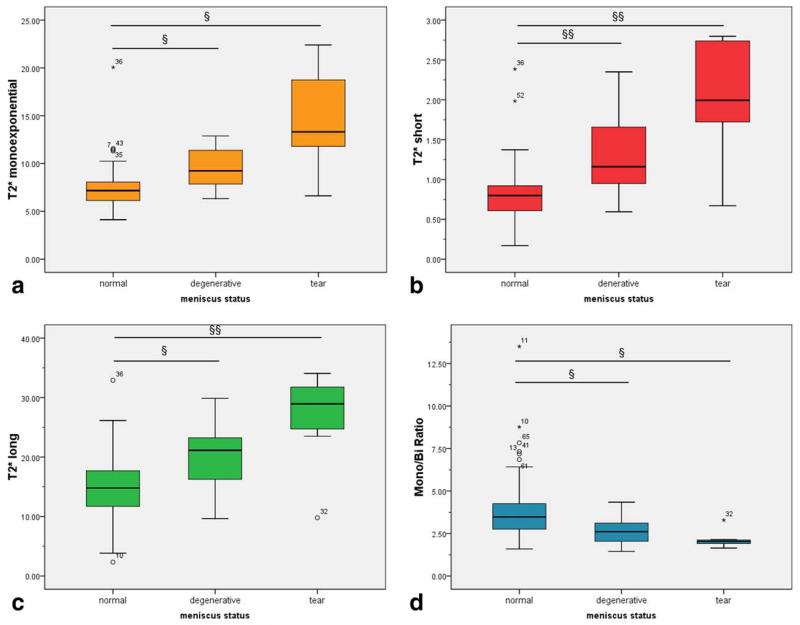
FIG. 4. The box-plot interpretation of monoexponential T2* (a), short component of T2* (b), long component of T2* (c), and the ratio between the pixel with monoexponential and biexponential characteristic (d) values.
Symbols § and §§ indicate statistical significance (P < 0.05 and P < 0.001, respectively).

