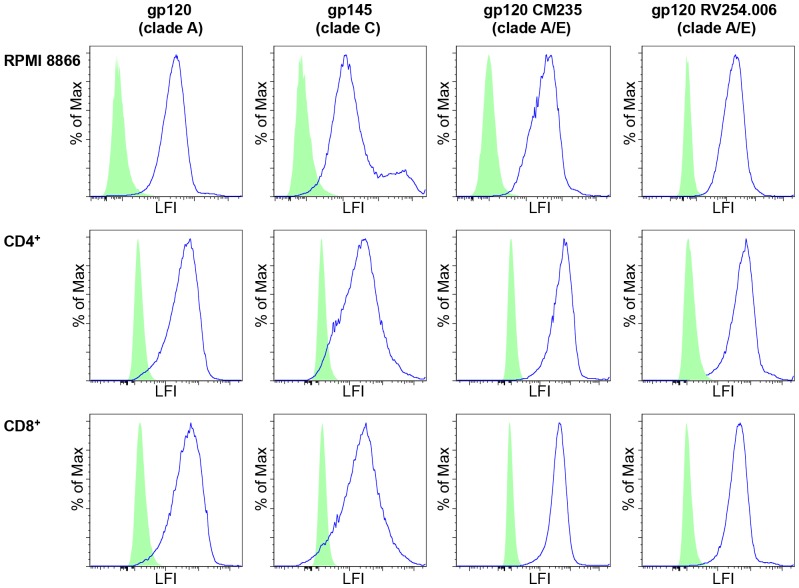
Figure 3. gp120 and gp145 bind α4β7 expressing cells.
The blue histograms show binding of biotin labeled variants of gp120 and biotin labeled gp145 to activated primary CD4+ T cells, CD8+ T cells and the RPMI 8866 cell line expressing α4β7. Each row represents a different cell type: row 1) RPMI 8866 cells; row 2) CD4+ T cells; row 3) CD8+ T cells. Each column represents a different ligand: column 1) gp120 of clade A; column 2) gp145 of clade C; column 3) gp120 (CM235) Clade A/E; column 4) gp120 (RV254.006) clade A/E. The green histogram shows background binding to the NeutraAvidin negative control, LFI = Log Fluorescence Intensity.

