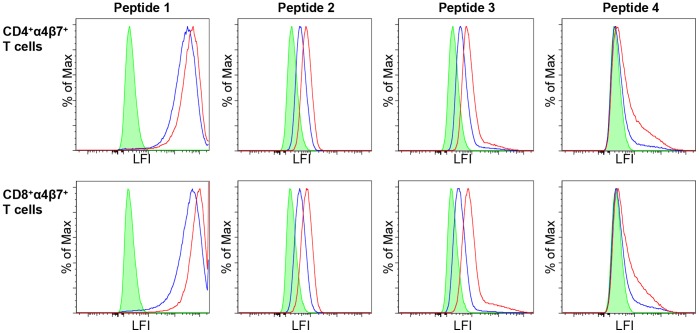
Figure 8. α4β7 diverse peptide binding assay.
The binding of the representative set of 4 diverse peptides listed in Table 1 to α4β7 on CD4+ T cells (top row) and α4β7 on CD8+ T cells (bottom row). All peptides were tested at both 2 µg (blue line) and 5 µg (red line). In both cell lines, Peptide 1, the most polar and soluble peptide, showed maximal binding, while Peptides 2 and 3 showed submaximal binding. Peptide 4 showed no reactivity in either primary cell type. Green histogram is NeutrAvidin control, LFI = Log Fluorescence Intensity.

