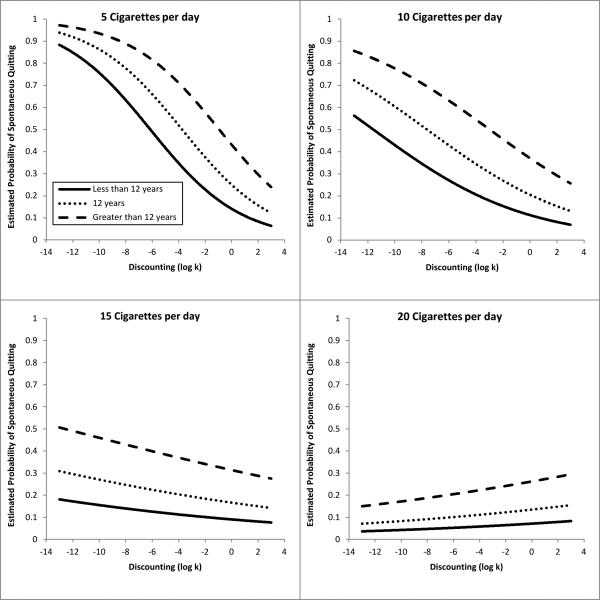
Figure 2.
Curves represent estimated probability of smoking in the final model, as a function of discounting (x-axis) and educational attainment (lines) at different levels of smoking. The four panels represent pre-pregnancy smoking rates of 5, 10, 15, and 20 cigarettes per day. Fit computed at the mean level of stress rating, age of smoking initiation, and quits during pregnancy and at the modal level of belief that smoking during pregnancy will “greatly harm my baby,” and marital status.

