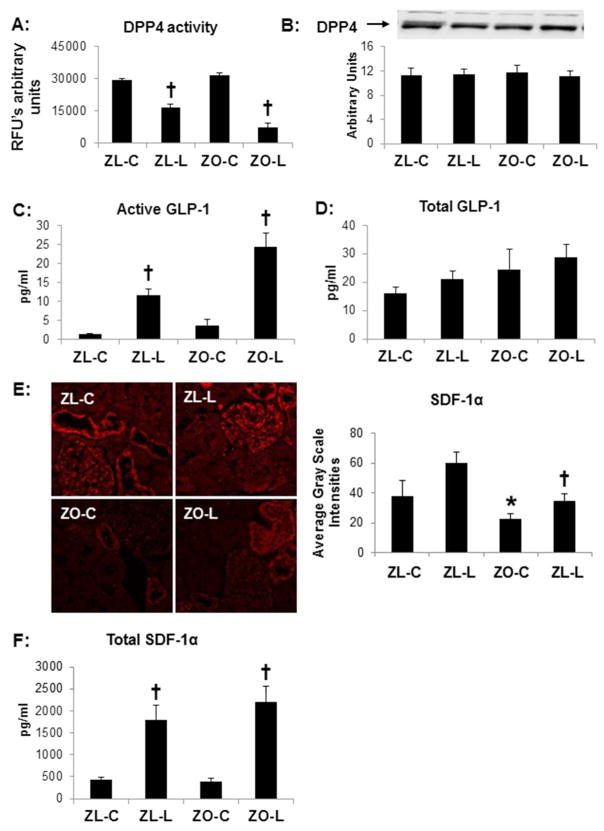
Figure 1. DPP4 inhibition in the Zucker obese (ZO) rat improves.
A) DPP4 kidney tissue activity but not B) expression as determined by western blot in the Zucker obese (ZO) rat. DPP4 inhibition also increases substrates C) circulating active GLP1 and D) SDF1-α determined by immunostaining with corresponding measures of intensity on the right. E) Representative images of SDF-1α immunostaining with corresponding measures of intensity to the right. F) Circulating levels of serum SDF-1α. Data are represented by means ± sterr. *, p< 0.05, when ZO controls (ZO-C) are compared to Zucker lean controls (ZL-C); †, p< 0.05 when linagliptin treated Zucker obese rats (ZO-L) are compared to ZO-C. For Western blot, equal loading was ensured via quantitation of Ponceau S.

