
Figure 2. DPP4 inhibition improves filtration barrier injury in the Zucker obese (ZO) rat.
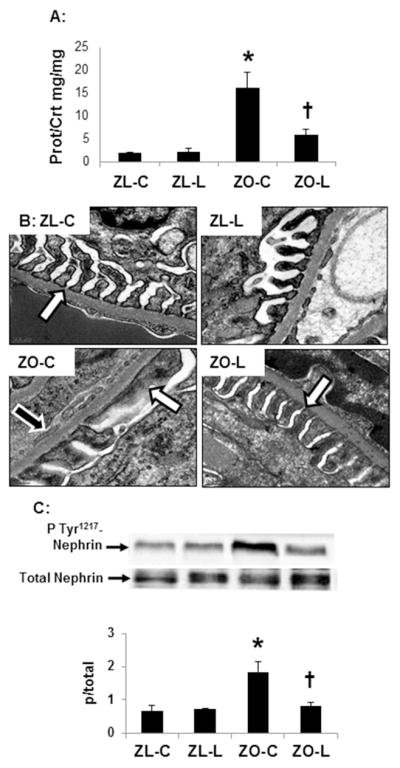
A) Measures of proteinuria. B) Ultrastructural analysis of the glomerular filtration barrier utilizing transmission electron microscopy. Images depict podocyte foot process effacement in the ZO rat with loss of the slit-pore membrane (white arrows) and endothelial fenestrae (black arrows) compared to ZL controls and linagliptin treated ZO rats. C) Western blot analysis of the ratio of phosphorylated (pTyr1217) to total of the podocyte-specific protein nephrin with quantitative analysis below. Data are represented by means ± sterr. *, p< 0.05, when ZO controls (ZO-C) are compared to zucker lean controls (ZL-C); †, p< 0.05 when linagliptin treated zucker obese rats (ZO-L) are compared to ZO-C. For Western blot, equal loading was ensured via quantitation of Ponceau S.