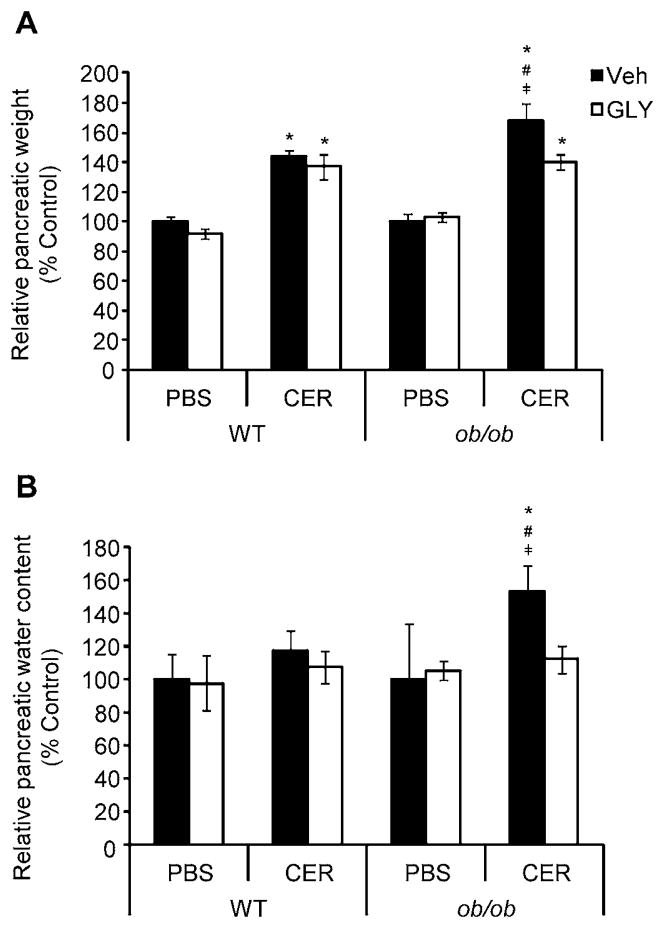
Figure 1. Relative pancreatic weight and water content in lean WT and obese ob/ob mice following cerulein-induced AP, with or without glyburide treatment.
AP was induced in lean WT and obese ob/ob via eight (8) hourly IP injections of cerulein (CER; 100 μg/kg or PBS (v/v) control) following glyburide (GLY; 500 mg/kg) or vehicle (Veh; v/v) treatment. (a) Following sacrifice, pancreata were removed and their relative weight determined as a percentage of total body weight. (b) A portion of each pancreas was subsequently weighed before and after drying in at 95 °C to determine water content. Results are expressed as percent control (within respective strains), mean ± s.e.m. n = 3–14 mice per group. *P < 0.05 vs. respective PBS-treated group. #P < 0.05 vs. respective WT group. ╪P < 0.05 vs. respective glyburide-treated group.

