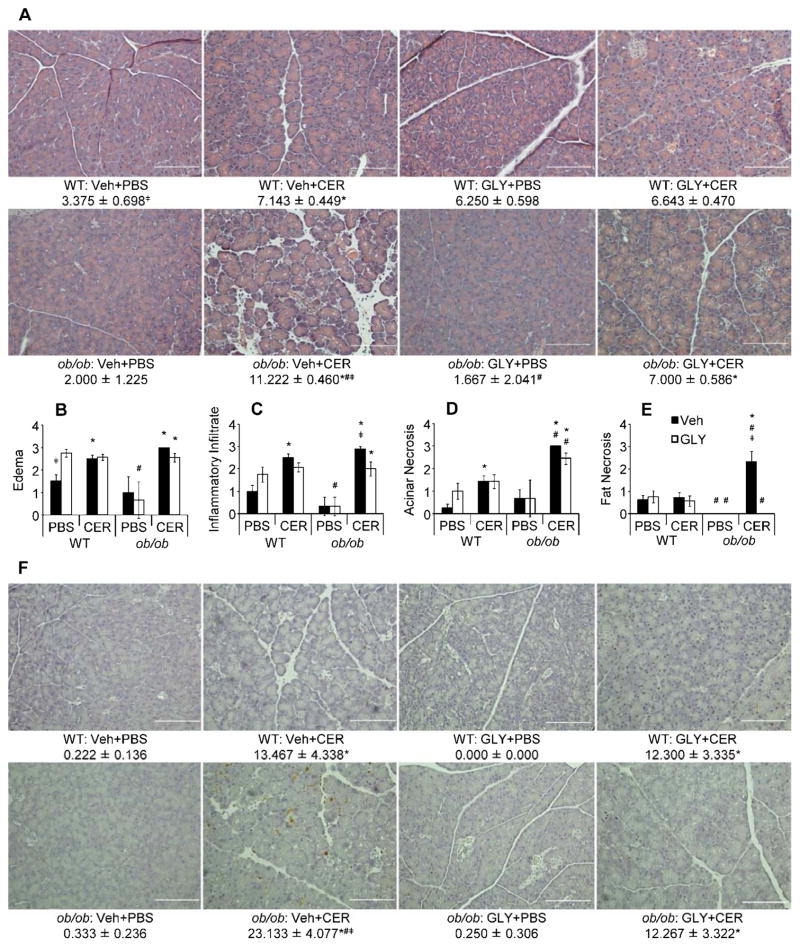
Figure 2. Pancreatic alterations and cell death in WT and ob/ob mice following cerulein-induced AP with or without glyburide treatment.
AP was induced in lean WT and obese ob/ob mice via eight (8) hourly IP injection of cerulein (CER; 100 μg/kg or PBS (v/v) control) following glyburide (GLY; 500 mg/kg) or vehicle (Veh; v/v) treatment. Following sacrifice, pancreata were removed and a portion fixed in formalin for paraffin embedding, slicing and staining with H&E or TUNEL. (a) Representative micrographs (200X) of H&E stained pancreatic sections, and summed H&E scores. (b–e) Individual H&E scores for (b) edema, (c) inflammatory infiltrate, (d) acinar necrosis and (e) intrapancreatic fat necrosis. (f) Representative micrographs (200X) of TUNEL stained pancreatic sections, and mean TUNEL scores (see methods section for scoring criteria/procedure). Summed H&E (a) results are expressed as total individual scores for edema, inflammatory infiltrate, acinar cell death and fat necrosis, mean ± s.e.m. n = 3–14 mice per group. Individual H&E score (b–e) results are expressed as mean ± s.e.m. n = 3–14 mice per group. TUNEL (f) results are expressed as mean number of TUNEL positive cells in 4 scored 200X microscopic fields, mean ± s.e.m. n = 3–5 mice per group. *P < 0.05 vs. respective PBS-treated group. #P < 0.05 vs. respective WT group. ╪P < 0.05 vs. respective glyburide-treated group.

