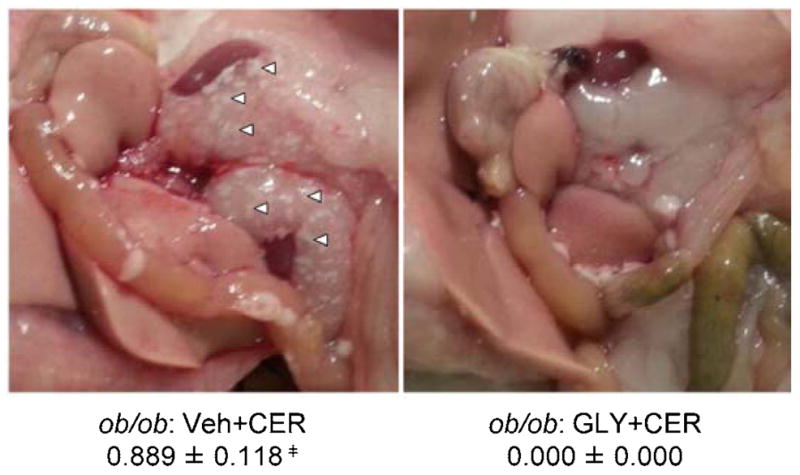
Figure 3. Peripancreatic fat necrosis in ob/ob mice following cerulein-induced AP with or without glyburide pretreatment.

AP was induced in obese ob/ob mice via eight (8) hourly IP injection of cerulein (CER; 100 μg/kg or PBS (v/v) control) following glyburide (GLY; 500 mg/kg) or vehicle (Veh; v/v) treatment. Following sacrifice, the peritoneal cavity was exposed and presence or absence of peripancreatic adipose tissue saponification determined. Representative photographs showing peripancreatic fat saponification (white arrows: representative indication of fat necrosis), and scores in vehicle treated (left) and glyburide treated ob/ob AP mice. Results are expressed as scores (presence = 1 or absence = 0), mean ± s.e.m. n = 9 mice per group. ╪P < 0.05, vs. respective glyburide treated group.
