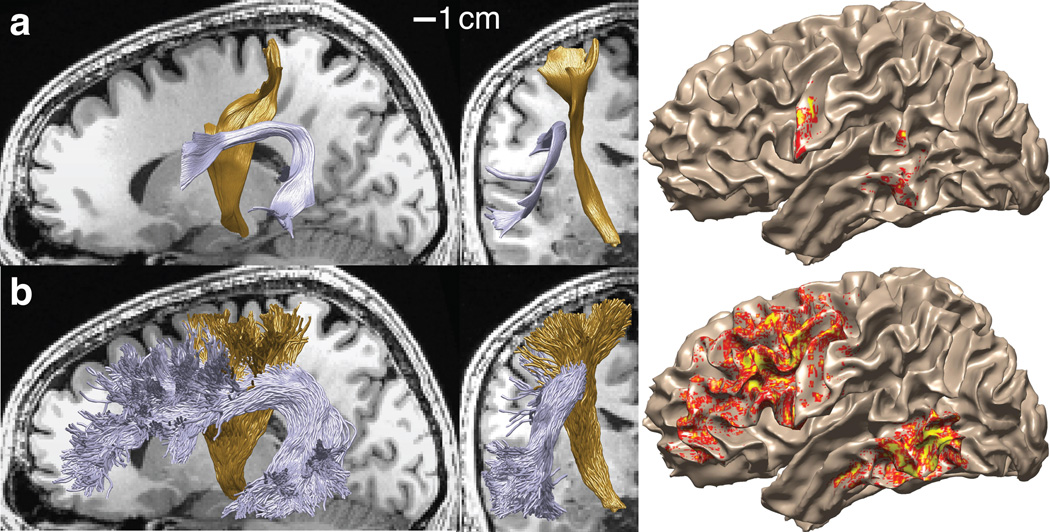
Figure 1.
Tract trajectory estimates and cortical projection zones differ markedly between tractography algorithms. (a) Deterministic tractography. Sagittal and coronal views of the arcuate fasciculus (purple) and cortico-spinal tract (gold) in a candidate connectome generated using deterministic tractography. The density with which the fiber projects onto the cortical surface are indicated by the color overlay. Yellow indicates highest fiber density. (b) Probabilistic tractography. As in part (a) except for a candidate connectome generated using probabilistic tractography. Supplementary Fig. 1 shows another example of the same problem.

