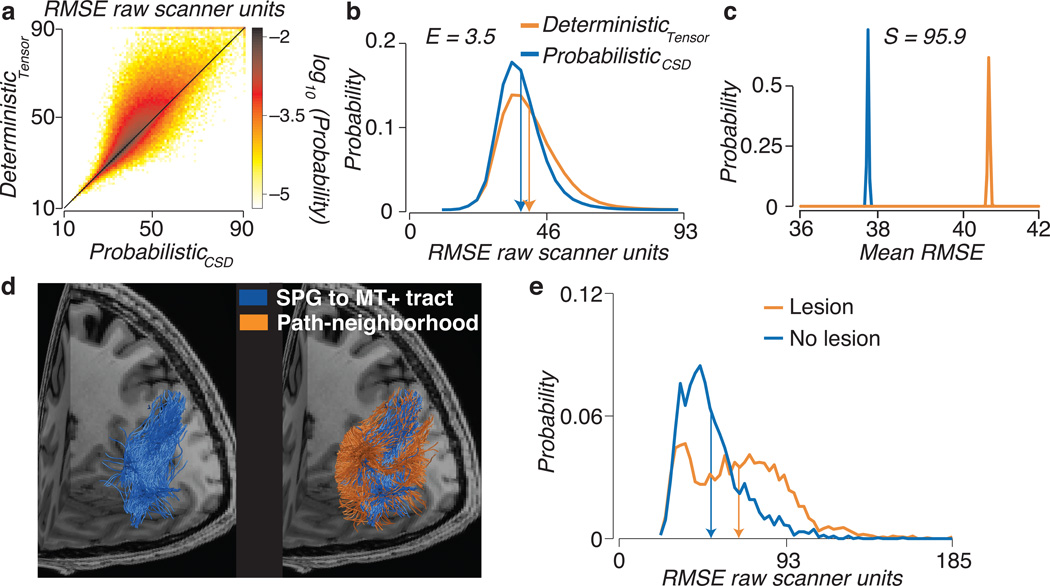
Figure 4.
Comparison of connectome models and virtual lesion method. (a) Voxel-wise prediction error. Error is show for whole-brain probabilistic (CSD, Lmax=10) and tensor-based deterministic optimized connectomes. Each white matter voxel has a cross-validated RMSE for both the optimal probabilistic and deterministic connectomes. The scatter-density plot compares these two values and shows that in a large majority of the white matter voxels the deterministic errors exceed the probabilistic errors. (b) Distribution of RMSE for probabilistic (CSD, Lmax=10) and tensor-based deterministic optimized connectomes. Histogram of RMSE for the two tractography models. The mean of each distribution is shown as vertical arrow. The Earth Movers Distance (E) quantifies the lower error for the Probabilistic model. (c) Distribution of mean RMSE. Representative bootstrap distribution of the mean RMSE. The Mean RMSE is higher for the deterministic than probabilistic connectome. There is very strong evidence favoring the probabilistic connectome over the deterministic connectome, S=95.9. All plots are for one brain data set STN96. See Supplementary Fig. 4 for additional information about S and E. (d) A novel pathway connecting hMT+ and the superior parietal gyrus (SPG) identified using a virtual lesion. Left. White matter fascicles intersecting hMT+ and SPG in the left hemisphere of one individual brain. Right. Path-neighborhood, fascicles sharing voxels with the hMT+ / SPG tract. (e) Distribution of RMSE for lesioned and unlesioned models. The RMSE increases (orange) as the hMT+ to SPG tract is removed. See Supplementary Fig. 4 for additional subjects and data sets.

