Figure 3.


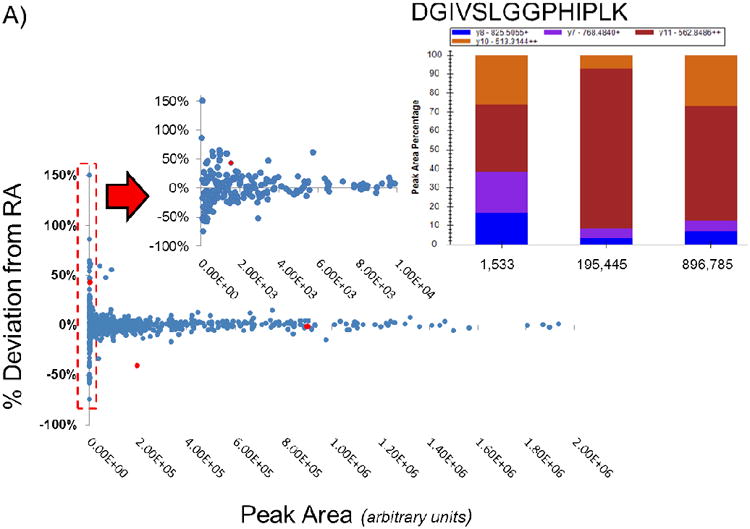
A: 684 data points gathered from injecting varying amounts of a 21 SIL peptide mixture are plotted based on the absolute peak area against the percent deviation from their expected RA value (2013). At low absolute abundance the deviation from the expected RA is highly variable. As the absolute abundance increases, an observed decrease in the deviation from the expected RA value is observed. The peptide DGIVSLGGPHIPLK is shown as an example of a peptide which has the same y11++ at different absolute abundances and with varying deviations from the expected RA value.
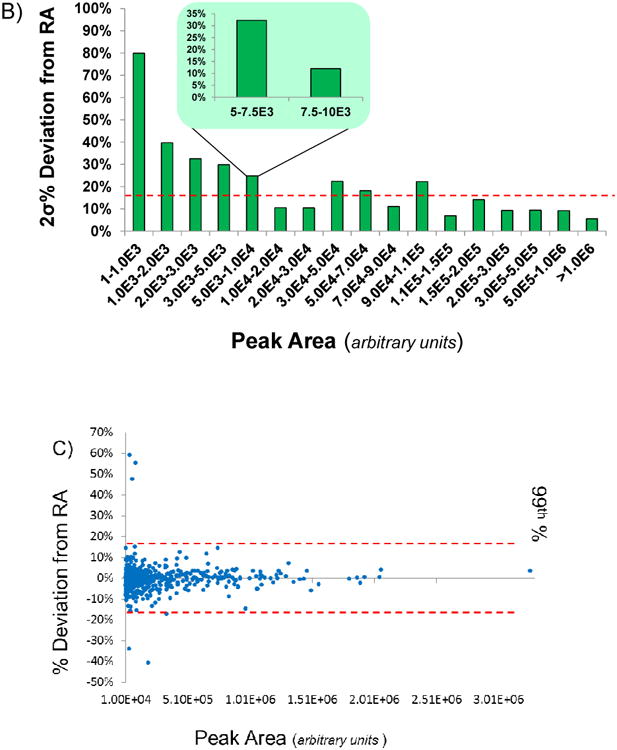
B: Data points gathered from injecting varying amounts of standard peptide mixture were binned based on their absolute area and plotted according to 2σ of each bin. At an absolute peak area above 10,000, the deviation of the RA value is observed to reach a constant of approximately 10-20%. Within the range of 5,000 – 10,000 the standard deviation of the measurements drop significantly at 7,500. The final threshold of 17.24% is indicated by the dotted line.
C: Data points with a peak area greater than 10,000 are examined in this plot. The 99th percentile of the data is shown by the red dotted line at 17.24%.
