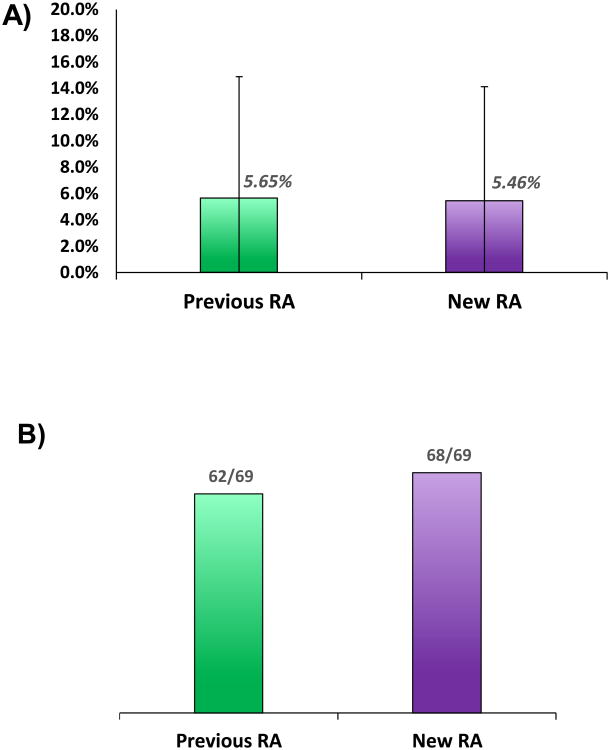
Figure 4.
A: Comparative plots showing the relative standard deviation for 23 peptides in 3 samples of wild-type P. trichocarpa stem differentiating xylem tissue for two methods of implementing RA thresholds. This plot shows a comparison of “Old” and “New” RA calculation methods with no significant difference between the RSD of the measurements made.
B: The percent of quantifiable data points was shown to increase using the new RA calculation and thresholds. Six additional data points out of sixty-nine were quantifiable using new methods.

