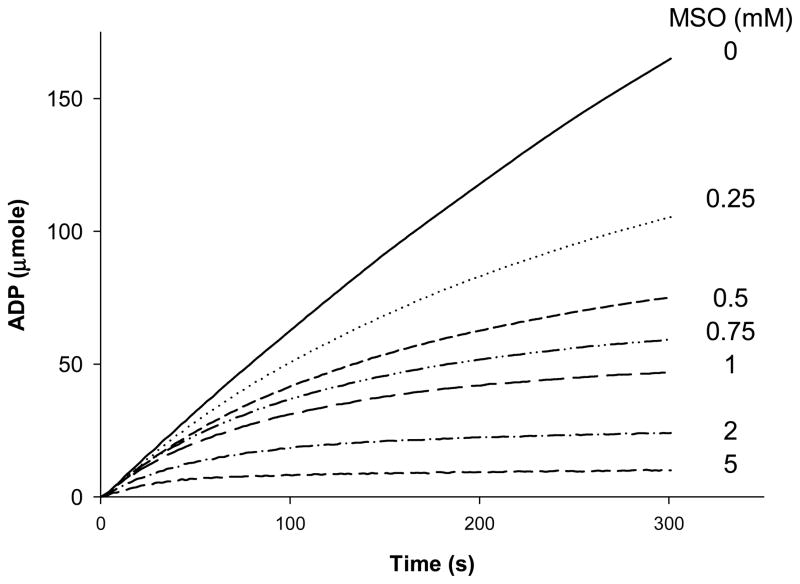
Figure 2. Inactivation of human glutamine synthetase by MSO.
Shown are the progress curves of the glutamine synthetase reaction in the presence of 20 mM glutamate and 0, 0.25, 0.5, 0.75, or 1.0 mM MSO. The curves represent the mean values of three separate determinations. For the sake of clarity, the SD values are not shown but were less than 5% of the mean in all cases.

