
. 2014 Sep 24;14:268. doi: 10.1186/s12888-014-0268-x
© Gonzalez-Liencres et al.; licensee BioMed Central Ltd. 2014
This is an Open Access article distributed under the terms of the Creative Commons Attribution License (http://creativecommons.org/licenses/by/4.0), which permits unrestricted use, distribution, and reproduction in any medium, provided the original work is properly credited. The Creative Commons Public Domain Dedication waiver (http://creativecommons.org/publicdomain/zero/1.0/) applies to the data made available in this article, unless otherwise stated.
Figure 1.
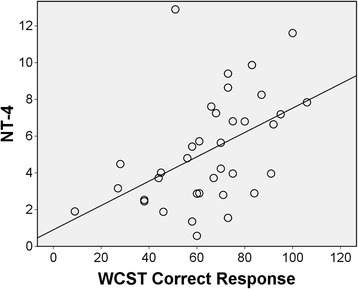
Scatterplot between NT4/5 and executive function (WCST correct responses).