Figure 2.

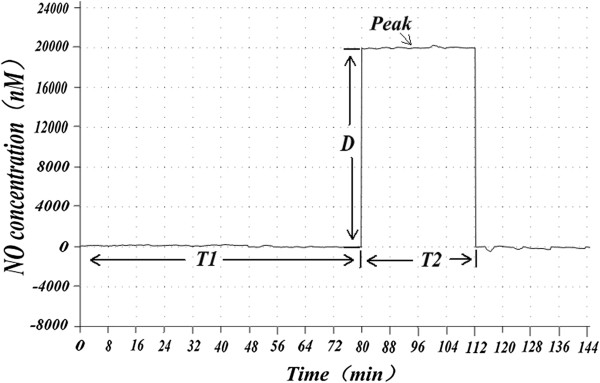
Nitric oxide concentration and its time change in abnormal sperm capacitation in vitro. T1, T2, and D as in Figure 1. In Figure 2, both T1 and T2 were longer in abnormal sperm than in normal sperm.

Nitric oxide concentration and its time change in abnormal sperm capacitation in vitro. T1, T2, and D as in Figure 1. In Figure 2, both T1 and T2 were longer in abnormal sperm than in normal sperm.