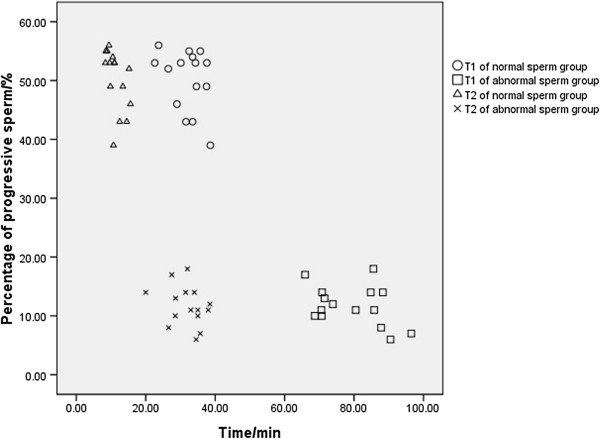
Figure 5.

The relationship between percentage of progressive sperm and time in normal and abnormal sperm groups. In this figure, the Y-axis represents the percentage of progressive sperm in all samples and the X-axis represents the time (T1 or T2) in the normal and abnormal sperm groups. The correlation between the percentage of progressive sperm and T1 (r = −0.952, p < 0.001, n = 15) and between the percentage of progressive sperm and T2 (r = −0.942, p < 0.001, n = 15) was established through Pearson’s correlation analysis. Using the independent sample t-test, the percentage of progressive sperm in the abnormal sperm group was obviously lower than the normal sperm group (t = 24.003, p < 0.001, n = 15).
