
Fig. 2.
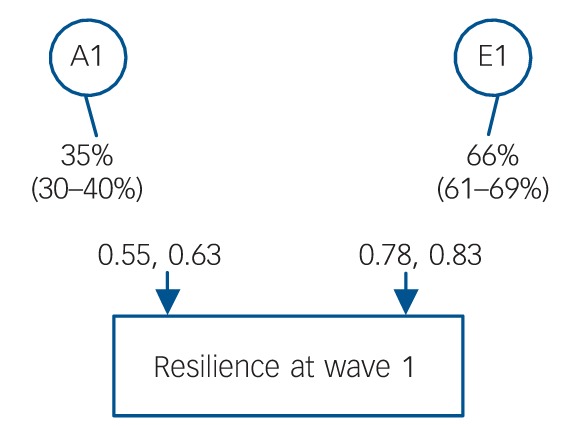
Percent of variance (with 95% CI) accounted for from the best-fitting model for genetic and environmental factors for resilience at wave 1: female-female and male-male twins.
Opposite-gender twins: genetic correlation rg = 0.38 estimated; -2 log likelihood (-2LL) = 24531.369 (d.f. = 8864), Akaike’s information criteria = 6803.369. A1, first (and only) additive genetic factor; E1, first (and only) individual-specific environmental factor.