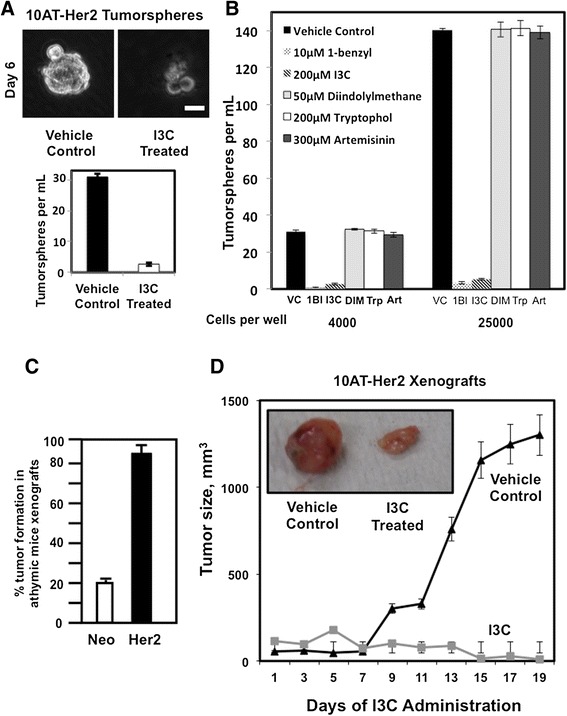
Figure 3.

Tumor xenograft-forming efficiency and tumorsphere and in vivo growth inhibition by I3C. (A) 10AT-Her2 cells were plated at a density of 4,000 cells per well in tumorsphere culture conditions and incubated with or without 200 μM I3C. After 6 days in cell suspension cultures, tumorsphere formation was assessed visually by phase microscopy and quantified. Scale bar represents 50 μm. (B) 10AT-Her2 cells were plated at a density of either 4,000 cells per well or 25,000 cells per well in tumorsphere culture conditions and then incubated with 10 μM 1-benzyl-I3C (1BI), 200 μM I3C, 50 μM DIM, 200 μM tryptophol (Trp), 300 μM artemisinin (Art) or with the DMSO vehicle control (VC). After 6 days in cell suspension cultures, tumorsphere formation was assessed visually by phase microscopy and quantified. (C) Three million 10AT-Neo cells (Neo) or 300,000 10AT-Her2 cells (Her2) were implanted in athymic mice, and 20 separate tumor injection sites were examined for palpable tumors after 5 weeks and quantified. (D) After the formation of detectable 10AT-Her2 cell-derived palpable tumor xenografts, athymic mice were treated subcutaneously with either 300 mg/kg of I3C or the DMSO vehicle control. Tumor volumes were quantified with a caliper from ten tumor xenografts per condition using two tumor sites per animal. The micrograph insert shows representative tumors excised from 2-week-post injection animals. 1BI, 1-benzyl-I3C; Art, artemisinin; DIM, 3,3'-dimethylindolylmethane; Her2, 10AT-Her2; I3C, indole-3-carbinol; Neo, 10AT-Neo; Trp, tryptophol; VC, vehicle control.
