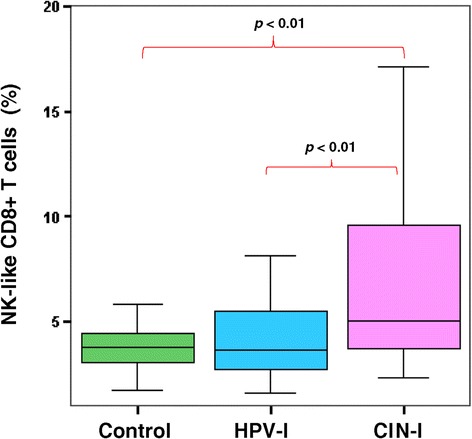
Figure 3.

Percentage of NK-like CD8+ T cells in control, HPV-I, and CIN-I groups. To identify these cells, we used the markers CD3+, CD8+ and CD16+/56 + dim/bright. By Analysis of variance (ANOVA) testing, we found an increase of Natural killer (NK)-like CD8+ T cells in the CIN-I group compared with the HPV-I and control groups (p <0.01).
