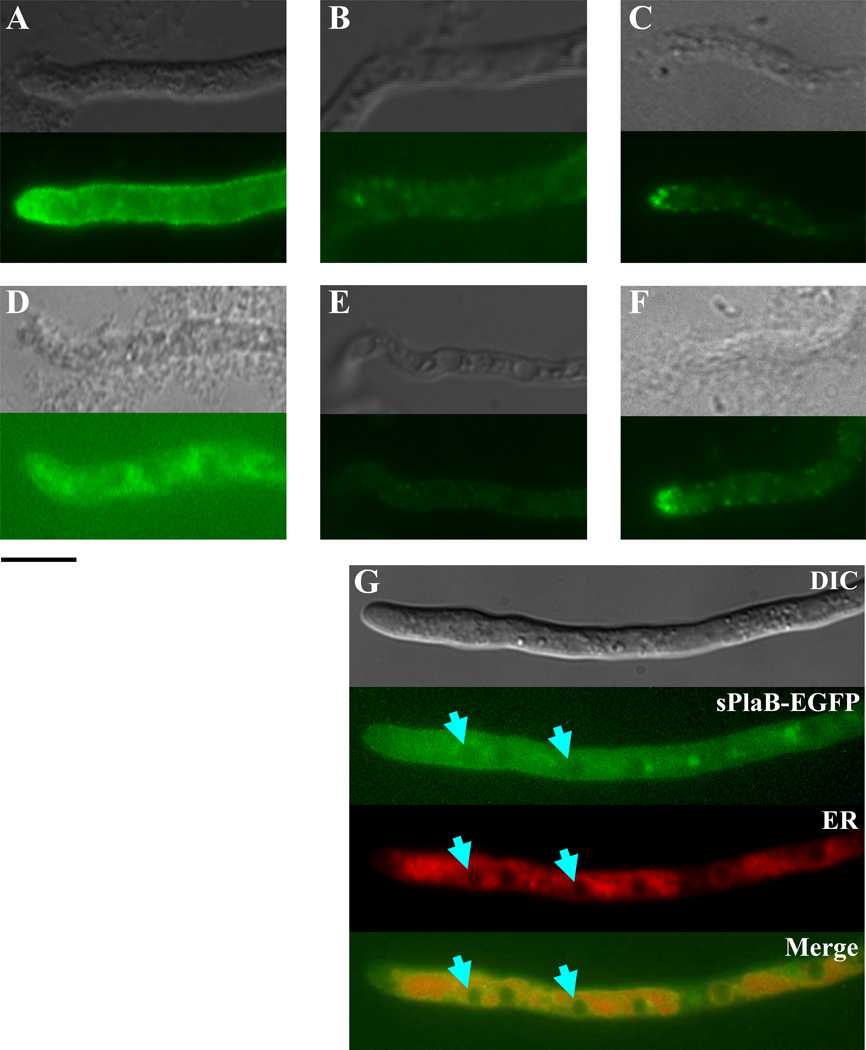
Fig. 5. Immunocytochemical localization of sPlaA and sPlaB in A. oryzae.
Immunostaining of OESA-1 (A) and OESB-1 (D) with the anti-sPlaA and the anti-sPlaB antibodies, respectively. Immunostaining of a ΔsplaA/ΔsplaB double disruptant strain (DSAB-1, see Fig. 8), utilized as a negative control, with anti-sPlaA and anti-sPlaB is shown in panels B and E. Immunostaining of OESA-1 (C) and OESB-1 (F) with an anti-actin antibody, which served as a positive control, is also shown. Light transmission (top) and fluorescence (bottom) images are reported in each panel. (G) Immunofluorescence (sPlaB-EGFP), ER-tracker staining (ER) and merged images of the sPlaB-EGFP expressing strain, SBfG; arrowheads indicate sPlaB co-localization sites revealed by EGFP fluorescence and ER-tracker staining. A differential interference contrast image is shown at the top; scale bar, 10 µm.

