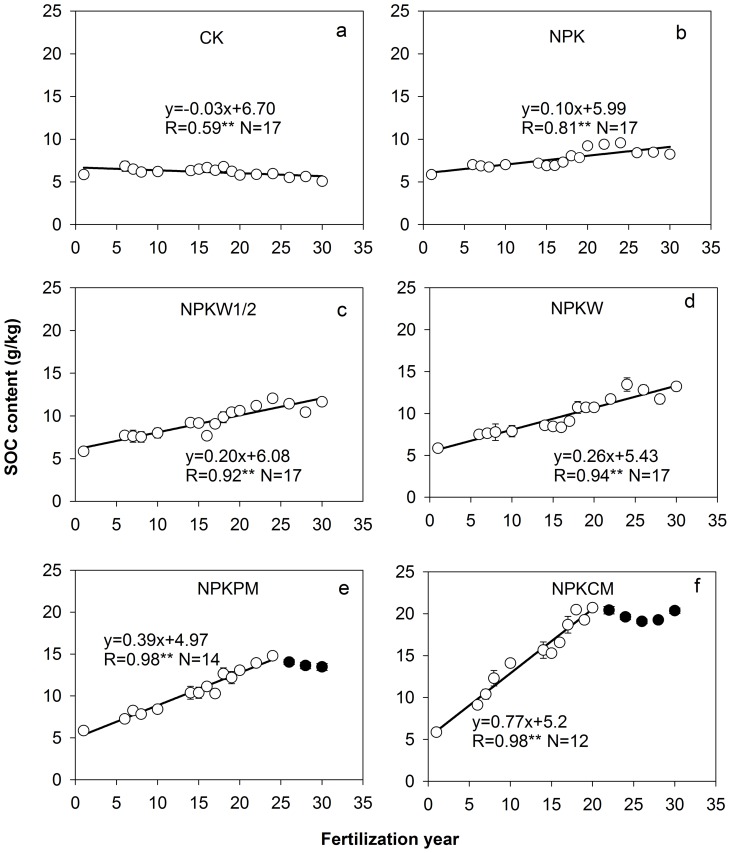
Figure 3. Changes in soil organic carbon (SOC) content over time in the six fertilization treatments during the period 1983 to 2011.
CK: no fertilizer (a); NPK: mineral NPK fertilizers alone (b); NPKW1/2: mineral NPK fertilizers combined with 2.5 ton/ha/yr of wheat straw (c); NPKW: mineral NPK fertilizers combined with 5.0 ton/ha/yr of wheat straw (d); NPKPM: mineral NPK fertilizers combined with pig manure (e); NPKCM: mineral NPK fertilizers combined with cattle manure (f); ** indicates significant correlation at P<0.01, respectively. Error bars indicated for some years are standard errors (n = 4).

