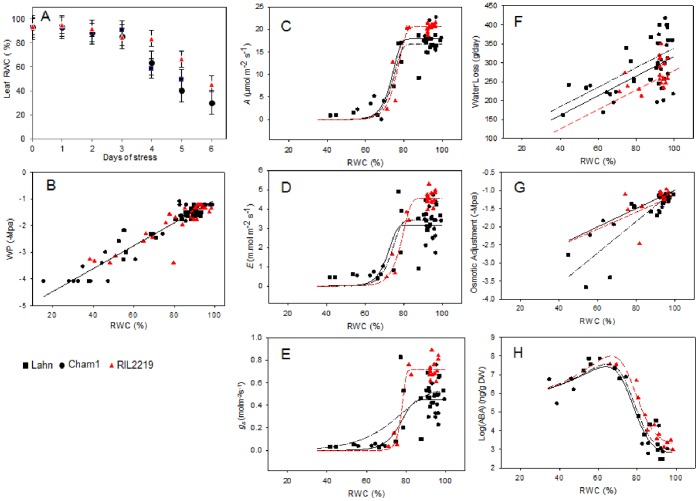
Figure 1. Physiological and biochemical parameters of leaves during water deficit.
Plant water status was measured by flag leaf %RWC as a function of days of stress (A), leaf water potential (B) and total plant water loss (F) during a stress transient of 0–6 days for three wheat lines Lahn (▪), Cham1 (•) and RIL2219 (▴). Leaf photosynthetic and biochemical parameters were CO2 assimilation (C), transpiration (D), stomatal conductance (E), osmotic adjustment (G) and ABA content (H). Linear regression analysis gave a single line relationship for leaf water potential, parallel lines (p<0.05, F-test) for water loss, and separate lines (p<0.05, F-test) for osmotic adjustment. Using the Gompertz curve, separate C and k parameters (p<0.05, F-tests) were required for CO2 assimilation, whereas for transpiration and stomatal conductance only separate C parameters (p<0.05, F-test) were required; (C–H) red line, black dashed line and black solid line are for RIL2219, Lahn and Cham1 respectively. For ABA, separate c parameters were significant (p<0.05, F-test) in the rational functions model.

