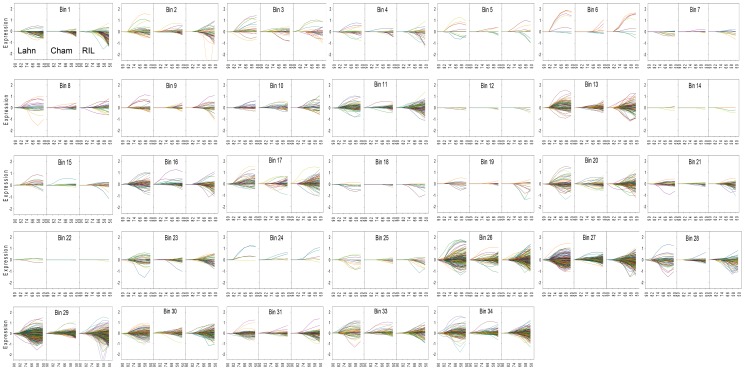
Figure 8. Differences in the global transcription profiles of the three lines under stress.
Expression of probes from the three lines, Lahn, Cham1 and RIL2219, as a function of leaf %RWC during the water stress transient, visualised in MapMan for all metabolic bins. For every bin, the same colour probe is plotted for each wheat line to enable direct comparison. Transcript profiles belong to the Line × Stress ANOVA group dataset (File S5).

