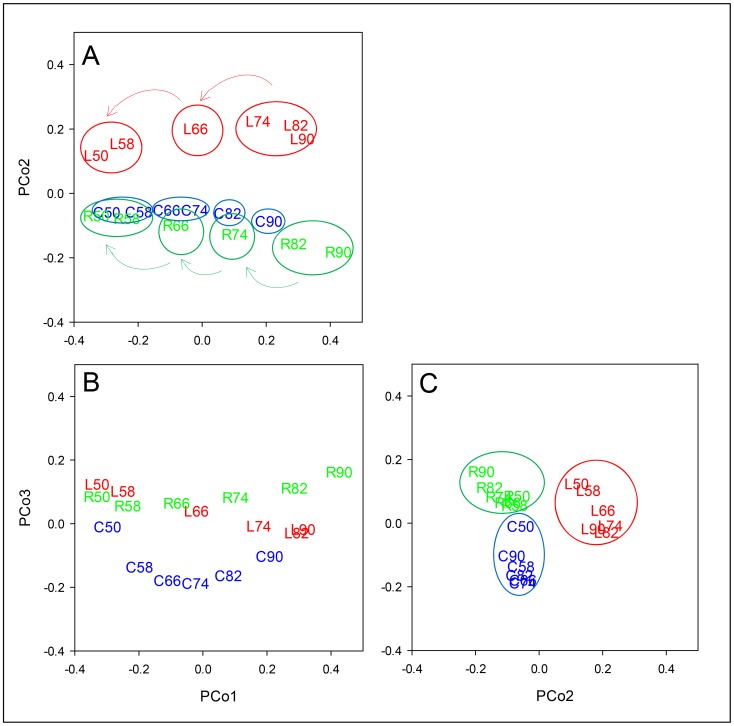
Figure 9. PCo plots for the expression of all 19062 probe dataset.
The first three PCos account for 72.8% of the variation represented in the (reduced) similarity matrix for the 18 wheat line by RWC combinations. Visualisation of the combinations in the three dimensions was achieved by plotting PCo1 vs. PCo2 (A), PCo1 vs. PCo3 (B) and PCo2 vs. PCo3 (C). Letters L, C and R represent the lines Lahn, Cham1 and RIL 2219 respectively at 90-50 leaf %RWC values. Arrows on plot A show the direction of the stress transient of decreasing leaf RWC and the free-drawn circles around the points highlight potential functional states for each line, inferred from distance between points.

