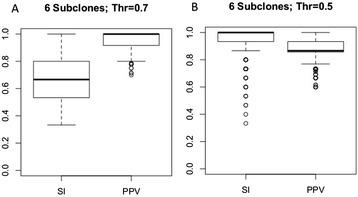
Figure 8.

Performance of mutation co-localization prediction on simulated data. (A) Co-localization prediction statistics on simulated dataset with six subclones in each tumor sample, and a threshold of 0.7. SI - Combined Sensitivity; PPV - Combined positive predictive value; (B) Co-localization prediction statistics on simulated dataset with six subclones in each tumor sample, and a CLF threshold at 0.5.
